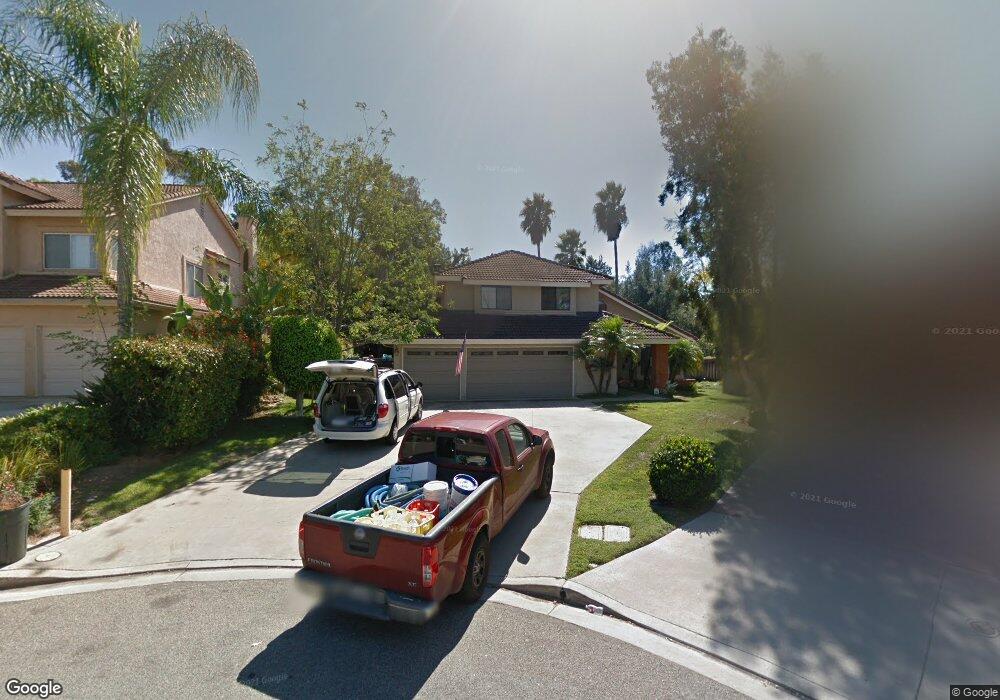
1060 Amethyst Way Escondido, CA 92029
Estimated Value: $669,000 - $1,992,000
4
Beds
5
Baths
2,271
Sq Ft
$578/Sq Ft
Est. Value
About This Home
This home is located at 1060 Amethyst Way, Escondido, CA 92029 and is currently estimated at $1,312,883, approximately $578 per square foot. 1060 Amethyst Way is a home located in San Diego County with nearby schools including Rock Springs Elementary School, Del Dios Academy of Arts & Sciences, and Escondido High School.
Ownership History
Date
Name
Owned For
Owner Type
Purchase Details
Closed on
Aug 4, 2021
Sold by
Linda Cook H and Linda Louise
Bought by
Cook Gregory D
Current Estimated Value
Purchase Details
Closed on
Mar 5, 2007
Sold by
Cook H Doug and Cook Linda Louise
Bought by
Cook Harry Douglas and Cook Linda L
Home Financials for this Owner
Home Financials are based on the most recent Mortgage that was taken out on this home.
Original Mortgage
$417,000
Interest Rate
6.55%
Mortgage Type
Stand Alone Refi Refinance Of Original Loan
Purchase Details
Closed on
Jun 15, 2000
Sold by
Silveus Charles B
Bought by
Cook H Doug and Cook Linda Louise
Home Financials for this Owner
Home Financials are based on the most recent Mortgage that was taken out on this home.
Original Mortgage
$237,550
Interest Rate
9.99%
Purchase Details
Closed on
Nov 29, 1990
Purchase Details
Closed on
Jun 15, 1988
Create a Home Valuation Report for This Property
The Home Valuation Report is an in-depth analysis detailing your home's value as well as a comparison with similar homes in the area
Home Values in the Area
Average Home Value in this Area
Purchase History
| Date | Buyer | Sale Price | Title Company |
|---|---|---|---|
| Cook Gregory D | -- | None Listed On Document | |
| Cook Harry Douglas | -- | Chicago Title Co | |
| Cook H Doug | $297,000 | First American Title | |
| -- | $311,000 | -- | |
| -- | $209,000 | -- |
Source: Public Records
Mortgage History
| Date | Status | Borrower | Loan Amount |
|---|---|---|---|
| Previous Owner | Cook Harry Douglas | $417,000 | |
| Previous Owner | Cook H Doug | $237,550 | |
| Closed | Cook H Doug | $44,600 |
Source: Public Records
Tax History Compared to Growth
Tax History
| Year | Tax Paid | Tax Assessment Tax Assessment Total Assessment is a certain percentage of the fair market value that is determined by local assessors to be the total taxable value of land and additions on the property. | Land | Improvement |
|---|---|---|---|---|
| 2025 | $6,683 | $731,253 | $156,702 | $574,551 |
| 2024 | $6,683 | $590,445 | $153,630 | $436,815 |
| 2023 | $5,495 | $480,829 | $150,618 | $330,211 |
| 2022 | $5,437 | $471,402 | $147,665 | $323,737 |
| 2021 | $5,349 | $462,160 | $144,770 | $317,390 |
| 2020 | $5,318 | $457,422 | $143,286 | $314,136 |
| 2019 | $5,190 | $448,454 | $140,477 | $307,977 |
| 2018 | $5,046 | $439,662 | $137,723 | $301,939 |
| 2017 | $4,965 | $431,042 | $135,023 | $296,019 |
| 2016 | $4,870 | $422,591 | $132,376 | $290,215 |
| 2015 | $4,830 | $416,244 | $130,388 | $285,856 |
| 2014 | $4,630 | $408,091 | $127,834 | $280,257 |
Source: Public Records
Map
Nearby Homes
- 1365 Oak View Way
- 962 Chardonney Way
- 0 Kauana Loa Dr Unit 18 250034208
- 0 Kauana Loa Dr Unit 17 250034204
- 0 Kauana Loa Dr Unit 16 250034203
- 0 Kauana Loa Dr Unit 15 250034201
- 2432 Live Oak Rd
- 0 Country Club Dr Unit 250019307
- 672 Chateau Place
- 0000 Country Club Dr Unit 2
- 1454 Romance Rd
- 955 Howard Ave Unit 40
- 1045 Howard Ave
- 21678 Long Trot Dr
- 21639 Trail Blazer Ln
- 21622 Saddle Bred Ln
- 1229 Sunrise View Unit 101
- 21644 Long Trot Dr
- 21578 Saddle Bred Ln
- 1209 Sunrise View Unit 103
- 1040 Amethyst Way
- 1062 Amethyst Way
- 1020 Amethyst Way
- 1059 Amethyst Way
- 1226 Country Club Dr
- 2763 Silver Oak Place
- 2760 Silver Oak Place
- 1326 Country Club Dr
- 2759 Silver Oak Place
- 1125 Oak View Way
- 1010 Amethyst Way
- 1224 Country Club Dr
- 2756 Silver Oak Place
- 995 Amethyst Way
- 1149 Oak View Way
- 1302 Country Club Dr
- 1324 Country Club Dr
- 1228 Country Club Dr
- 955 Chardonney Way
- 2752 Silver Oak Place