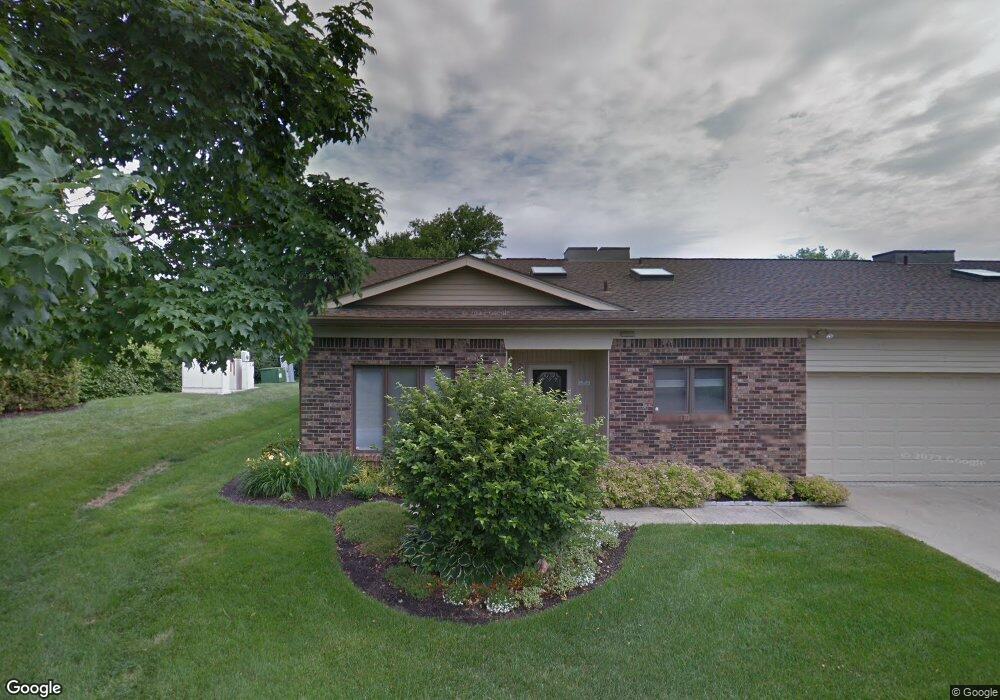
1060 Andalusia Grove Unit 31 Indianapolis, IN 46260
Saint Vincent-Greenbriar NeighborhoodEstimated Value: $144,000 - $345,000
2
Beds
2
Baths
1,176
Sq Ft
$177/Sq Ft
Est. Value
About This Home
This home is located at 1060 Andalusia Grove Unit 31, Indianapolis, IN 46260 and is currently estimated at $207,863, approximately $176 per square foot. 1060 Andalusia Grove Unit 31 is a home located in Marion County with nearby schools including Greenbriar Elementary School, Westlane Middle School, and North Central High School.
Ownership History
Date
Name
Owned For
Owner Type
Purchase Details
Closed on
Jul 21, 2008
Sold by
Howell Marion M and Schimmelpfennig Marion M
Bought by
Howell Marion M
Current Estimated Value
Purchase Details
Closed on
Apr 24, 2008
Sold by
Schimmelpfennig Hal E
Bought by
Schimmelpfennig Marion M
Purchase Details
Closed on
Jun 29, 2007
Sold by
Wilson Larry L and Wilson Carolyn S
Bought by
Schimmelpfennig Hal E
Purchase Details
Closed on
Apr 10, 2007
Sold by
Schroeder Joy R and Lucas Richard A
Bought by
Wilson Larry L and Wilson Carolyn S
Create a Home Valuation Report for This Property
The Home Valuation Report is an in-depth analysis detailing your home's value as well as a comparison with similar homes in the area
Home Values in the Area
Average Home Value in this Area
Purchase History
| Date | Buyer | Sale Price | Title Company |
|---|---|---|---|
| Howell Marion M | -- | Stewart Title | |
| Schimmelpfennig Marion M | -- | Stewart Title | |
| Schimmelpfennig Hal E | -- | Stewart Title | |
| Wilson Larry L | -- | None Available |
Source: Public Records
Tax History Compared to Growth
Tax History
| Year | Tax Paid | Tax Assessment Tax Assessment Total Assessment is a certain percentage of the fair market value that is determined by local assessors to be the total taxable value of land and additions on the property. | Land | Improvement |
|---|---|---|---|---|
| 2024 | $2,530 | $209,800 | $39,100 | $170,700 |
| 2023 | $2,394 | $202,100 | $38,800 | $163,300 |
| 2022 | $2,597 | $202,100 | $38,800 | $163,300 |
| 2021 | $2,093 | $166,000 | $37,400 | $128,600 |
| 2020 | $1,745 | $150,200 | $36,700 | $113,500 |
| 2019 | $1,691 | $153,700 | $37,000 | $116,700 |
| 2018 | $1,320 | $131,600 | $35,900 | $95,700 |
| 2017 | $1,280 | $130,200 | $35,800 | $94,400 |
| 2016 | $1,213 | $130,200 | $35,800 | $94,400 |
| 2014 | $1,013 | $128,200 | $36,000 | $92,200 |
| 2013 | $1,240 | $140,200 | $36,600 | $103,600 |
Source: Public Records
Map
Nearby Homes
- 1113 Canterbury Square S
- 8521 Canterbury Square E
- 1131 Canterbury Square S
- 1053 Millwood Ct Unit 3
- 1151 Canterbury Square S
- 8649 Cricket Tree Ln
- 8661 Williamshire Dr W
- 841 Alverna Dr
- 8133 Groton Ln
- 8526 Oakmont Ln
- 910 Claridge Ct
- 1702 Charter Oak Cir
- 8250 Shadow Cir
- 947 Tamarack Circle North Dr
- 9111 Ditch Rd
- 958 Tamarack Circle Dr N
- 9263 Spring Forest Dr Unit 7
- 927 Stockton St
- 9218 Brantford Ct
- 1208 W 79th St
- 1060 Andalusia Grove
- 1060 Andalusia Grove Unit 1
- 1060 Andalusia Grove Unit 3
- 1056 Andalusia Grove
- 1052 Andalusia Grove
- 1052 Andalusia Grove Unit 31-3
- 1063 Winterthur
- 1059 Winterthur
- 1059 Winterthur Unit 3
- 1063 Andalusia Grove
- 1063 Andalusia Grove Unit 4
- 1048 Andalusia Grove
- 1055 Winterthur
- 1105 Canterbury Square S
- 1059 Andalusia Grove
- 1107 Canterbury Square S
- 1055 Andalusia Grove Ct Unit 24-2
- 1055 Andalusia Grove
- 1055 Andalusia Grove Unit 2
- 1051 Winterthur