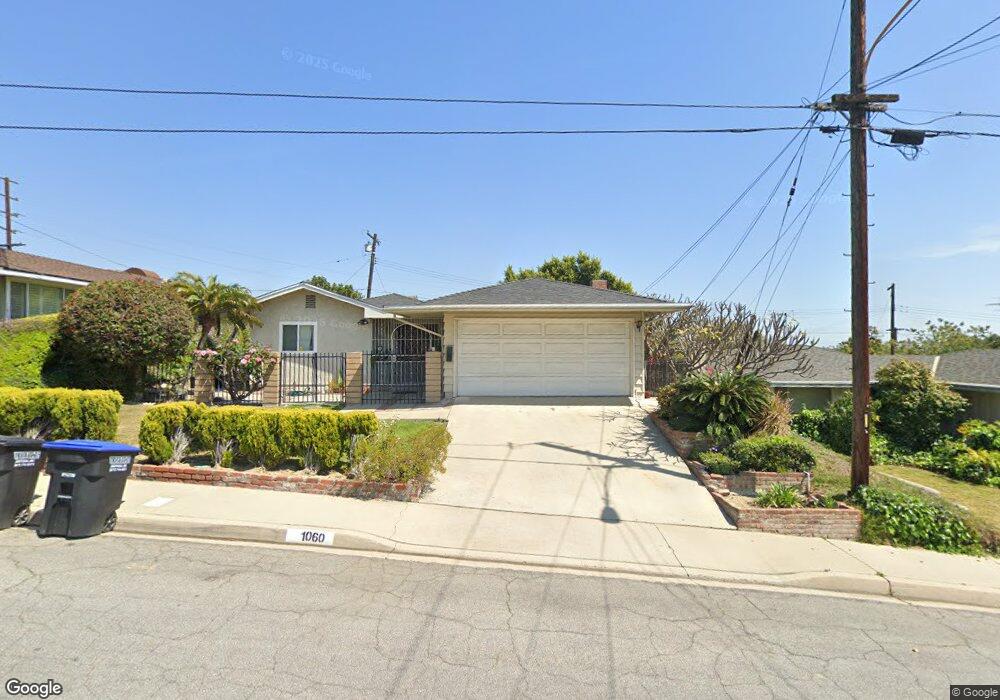
1060 Bradshawe Ave Monterey Park, CA 91754
Estimated Value: $934,468 - $1,124,000
3
Beds
2
Baths
1,686
Sq Ft
$623/Sq Ft
Est. Value
About This Home
This home is located at 1060 Bradshawe Ave, Monterey Park, CA 91754 and is currently estimated at $1,049,617, approximately $622 per square foot. 1060 Bradshawe Ave is a home located in Los Angeles County with nearby schools including Repetto Elementary School, Mark Keppel High School, and Monterey Park Christian School.
Ownership History
Date
Name
Owned For
Owner Type
Purchase Details
Closed on
Aug 1, 2024
Sold by
Cheung Shen Emily Manping
Bought by
Emily Manping Cheung Shen Family Trust and Shen
Current Estimated Value
Purchase Details
Closed on
May 1, 2020
Sold by
Shen Emily Manping and Shen Manchun Marina
Bought by
Shen Emily Manping and Tse Marina Manchun
Home Financials for this Owner
Home Financials are based on the most recent Mortgage that was taken out on this home.
Original Mortgage
$125,000
Interest Rate
3.3%
Mortgage Type
New Conventional
Purchase Details
Closed on
Apr 27, 2020
Sold by
Anderson Richard Louis
Bought by
Tse Man Chun Marina
Home Financials for this Owner
Home Financials are based on the most recent Mortgage that was taken out on this home.
Original Mortgage
$125,000
Interest Rate
3.3%
Mortgage Type
New Conventional
Purchase Details
Closed on
Dec 2, 2019
Sold by
Shen Ray and Shen Emily Manping
Bought by
Shen Emily Manping and Shen Manchun Marina
Create a Home Valuation Report for This Property
The Home Valuation Report is an in-depth analysis detailing your home's value as well as a comparison with similar homes in the area
Home Values in the Area
Average Home Value in this Area
Purchase History
| Date | Buyer | Sale Price | Title Company |
|---|---|---|---|
| Emily Manping Cheung Shen Family Trust | -- | None Listed On Document | |
| Shen Emily Manping | -- | North American Title | |
| Tse Man Chun Marina | -- | North American Title | |
| Shen Emily Manping | -- | None Available |
Source: Public Records
Mortgage History
| Date | Status | Borrower | Loan Amount |
|---|---|---|---|
| Previous Owner | Shen Emily Manping | $125,000 |
Source: Public Records
Tax History Compared to Growth
Tax History
| Year | Tax Paid | Tax Assessment Tax Assessment Total Assessment is a certain percentage of the fair market value that is determined by local assessors to be the total taxable value of land and additions on the property. | Land | Improvement |
|---|---|---|---|---|
| 2025 | $5,660 | $421,683 | $195,221 | $226,462 |
| 2024 | $5,660 | $413,416 | $191,394 | $222,022 |
| 2023 | $5,543 | $405,311 | $187,642 | $217,669 |
| 2022 | $5,283 | $397,364 | $183,963 | $213,401 |
| 2021 | $5,212 | $389,573 | $180,356 | $209,217 |
| 2019 | $5,029 | $378,019 | $175,007 | $203,012 |
| 2018 | $5,004 | $370,608 | $171,576 | $199,032 |
| 2016 | $4,632 | $356,218 | $164,914 | $191,304 |
| 2015 | $4,560 | $350,868 | $162,437 | $188,431 |
| 2014 | $4,502 | $343,996 | $159,256 | $184,740 |
Source: Public Records
Map
Nearby Homes
- 1100 S Grandridge Ave
- 1240 S Ynez Ave
- 650 W El Repetto Dr
- 1351 S Ynez Ave
- 1701 S Mcpherrin Ave
- 1301 S Atlantic Blvd Unit 234C
- 824 De la Fuente St
- 1027 De la Fuente St
- 1800 Fernbank Ave
- 500 A S Garfield Unit A
- 1804 Wilcox Ave
- 701 S Garfield Ave
- 2012 S Garfield Ave
- 863 S Lincoln Ave
- 501 W Floral Dr
- 419 S Chandler Ave Unit 521
- 408 De la Fuente St
- 125 E Arlight St
- 105 E Floral Dr
- 413 W Riggin St
- 1050 Bradshawe Ave
- 1070 Bradshawe Ave
- 1048 Bradshawe Ave
- 1080 Bradshawe Ave
- 1051 Bradshawe Ave
- 1061 Bradshawe Ave
- 1044 Bradshawe Ave
- 1049 Bradshawe Ave
- 1049 S Bradshawe Ave
- 1193 Punta Way
- 1100 S Bradshawe Ave
- 1081 Bradshawe Ave
- 1047 Bradshawe Ave
- 1100 Punta Way
- 1040 S Bradshawe Ave
- 1150 Bradshawe Ave
- 1201 Punta Way
- 1045 Bradshawe Ave
- 1051 Divina Vista St
- 1038 Bradshawe Ave