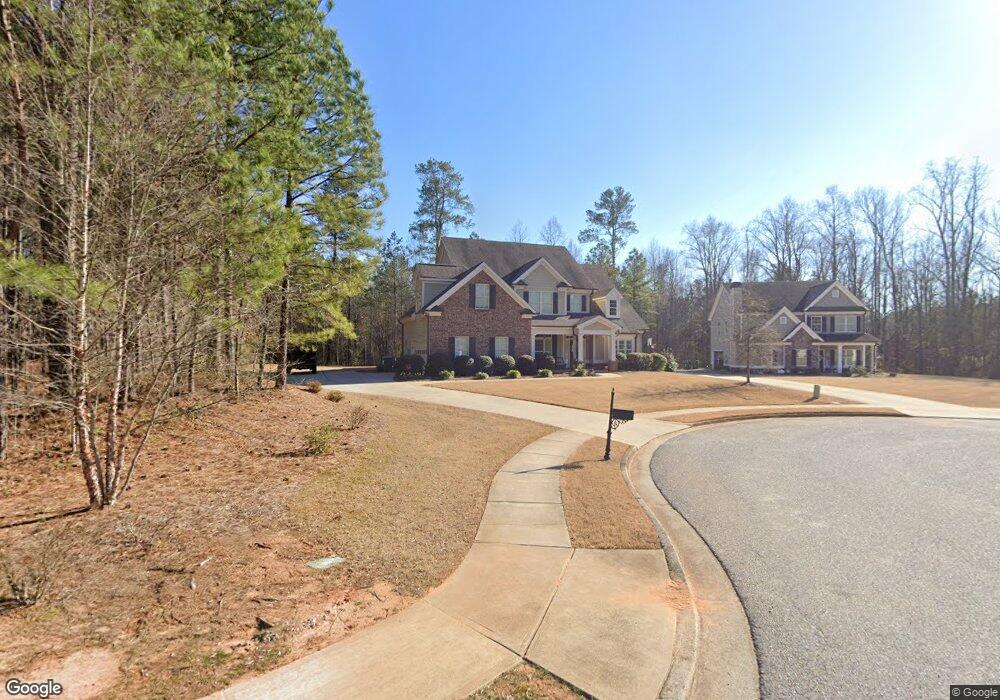
1060 Whitlow Ridge Dr Unit 10C Bishop, GA 30621
Estimated Value: $604,978 - $649,000
4
Beds
3
Baths
2,747
Sq Ft
$229/Sq Ft
Est. Value
About This Home
This home is located at 1060 Whitlow Ridge Dr Unit 10C, Bishop, GA 30621 and is currently estimated at $628,495, approximately $228 per square foot. 1060 Whitlow Ridge Dr Unit 10C is a home located in Oconee County with nearby schools including High Shoals Elementary School, Oconee County Middle School, and Oconee County High School.
Ownership History
Date
Name
Owned For
Owner Type
Purchase Details
Closed on
Dec 15, 2017
Sold by
Mabe Coy Edward
Bought by
Murphy Roderick Shawn and Murphy Marilyn Smith
Current Estimated Value
Home Financials for this Owner
Home Financials are based on the most recent Mortgage that was taken out on this home.
Original Mortgage
$226,000
Outstanding Balance
$190,321
Interest Rate
3.95%
Mortgage Type
New Conventional
Estimated Equity
$438,174
Purchase Details
Closed on
Jul 14, 2015
Sold by
Scout Construction Llc
Bought by
Mabe Coy Edward and Mabe Laurie C
Home Financials for this Owner
Home Financials are based on the most recent Mortgage that was taken out on this home.
Original Mortgage
$175,500
Interest Rate
4.04%
Mortgage Type
New Conventional
Purchase Details
Closed on
Feb 28, 2013
Sold by
Evans Mill Development Inc
Bought by
Bank Of Madison
Create a Home Valuation Report for This Property
The Home Valuation Report is an in-depth analysis detailing your home's value as well as a comparison with similar homes in the area
Home Values in the Area
Average Home Value in this Area
Purchase History
| Date | Buyer | Sale Price | Title Company |
|---|---|---|---|
| Murphy Roderick Shawn | $340,000 | -- | |
| Mabe Coy Edward | $316,500 | -- | |
| Bank Of Madison | -- | -- |
Source: Public Records
Mortgage History
| Date | Status | Borrower | Loan Amount |
|---|---|---|---|
| Open | Murphy Roderick Shawn | $226,000 | |
| Previous Owner | Mabe Coy Edward | $175,500 |
Source: Public Records
Tax History Compared to Growth
Tax History
| Year | Tax Paid | Tax Assessment Tax Assessment Total Assessment is a certain percentage of the fair market value that is determined by local assessors to be the total taxable value of land and additions on the property. | Land | Improvement |
|---|---|---|---|---|
| 2024 | $4,096 | $219,221 | $30,000 | $189,221 |
| 2023 | $4,099 | $204,860 | $28,000 | $176,860 |
| 2022 | $4,044 | $188,618 | $28,000 | $160,618 |
| 2021 | $3,454 | $149,453 | $18,000 | $131,453 |
| 2020 | $3,271 | $141,338 | $18,000 | $123,338 |
| 2019 | $3,130 | $135,245 | $18,000 | $117,245 |
| 2018 | $3,186 | $134,812 | $18,000 | $116,812 |
| 2017 | $3,032 | $128,320 | $18,000 | $110,320 |
| 2016 | $2,836 | $120,039 | $18,000 | $102,039 |
| 2015 | $270 | $9,760 | $9,760 | $0 |
| 2014 | $214 | $7,200 | $7,200 | $0 |
| 2013 | -- | $3,220 | $3,220 | $0 |
Source: Public Records
Map
Nearby Homes
- 2893 Whitlow Ridge Dr
- 2161 Union Church Rd
- 6534 Whitlow Creek Dr
- 1141 Southwind Dr
- 1010 Oconee Forest Ln
- 1011 Sharon Place
- 1150 Glen Ln
- 00 Old Bishop Rd
- 0 Old Bishop Rd Unit 10608387
- 1713 Townside Dr
- 1171 Spring Lake Dr
- 1190 Old Bishop Rd
- 1410 Old Bishop Rd
- 1364 Old Bishop Rd
- 1025 Stonewood Field Rd
- 1295 Stonewood Field Rd
- 1805 Stonewood Field Rd
- 1060 Whitlow Ridge Dr
- 1000 Whitlow Ridge Dr
- 1892 Whitlow Ridge Dr
- 1892 Whitlow Ridge Dr Unit 8C
- 2008 Whitlow Ridge Dr
- 1716 Whitlow Ridge Dr Unit 9C
- 1716 Whitlow Ridge Dr
- 1001 Whitlow Ridge Dr
- 1073 Whitlow Ridge Dr
- 2126 Whitlow Ridge Dr
- 2126 Whitlow Ridge Dr Unit 6C
- 1185 Whitlow Ridge Dr
- 1305 Whitlow Ridge Dr
- 1967 Whitlow Ridge Dr
- 1266 Whitlow Creek Ct
- 1403 Whitlow Ridge Dr
- 1652 Whitlow Creek Dr
- 1833 Whitlow Ridge Dr
- 1548 Whitlow Creek Dr
- 1701 Whitlow Ridge Dr