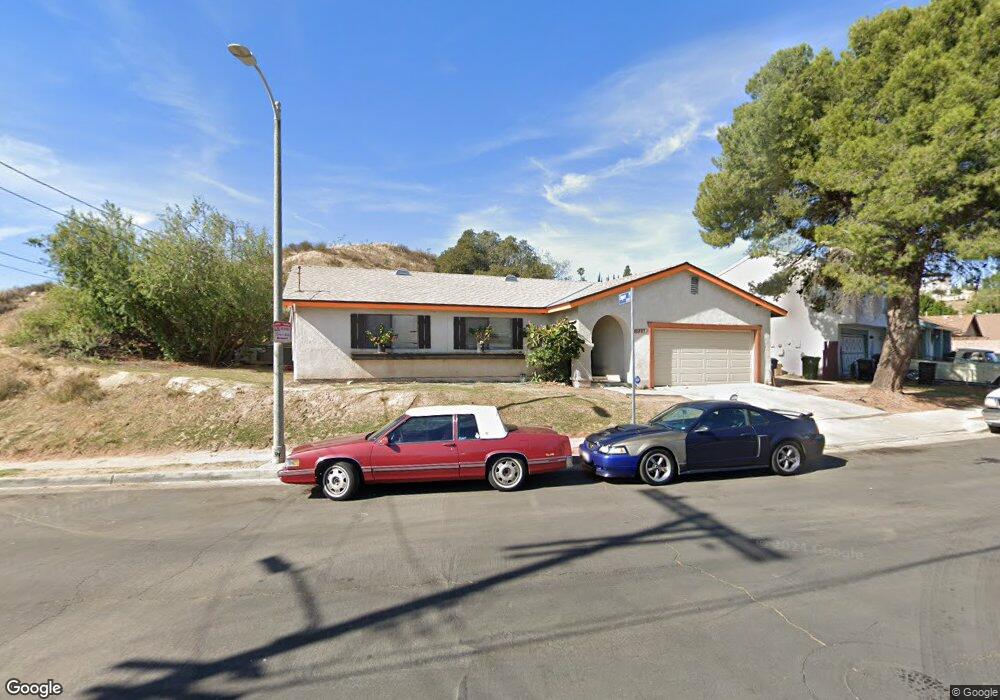
10605 Empire Dr Pacoima, CA 91331
Estimated Value: $693,832 - $825,000
3
Beds
2
Baths
1,484
Sq Ft
$530/Sq Ft
Est. Value
About This Home
This home is located at 10605 Empire Dr, Pacoima, CA 91331 and is currently estimated at $786,458, approximately $529 per square foot. 10605 Empire Dr is a home located in Los Angeles County with nearby schools including Charles Maclay Middle School, San Fernando Senior High School, and Fenton Primary Center.
Ownership History
Date
Name
Owned For
Owner Type
Purchase Details
Closed on
May 1, 2018
Sold by
Williams Sophia G
Bought by
Williams Sophia G and Sophia G Williams Revocable Li
Current Estimated Value
Purchase Details
Closed on
Jul 9, 2002
Sold by
Williams Oscar L and Williams Sophia G
Bought by
Williams Oscar L and Williams Sophia G
Home Financials for this Owner
Home Financials are based on the most recent Mortgage that was taken out on this home.
Original Mortgage
$115,000
Interest Rate
5.56%
Create a Home Valuation Report for This Property
The Home Valuation Report is an in-depth analysis detailing your home's value as well as a comparison with similar homes in the area
Home Values in the Area
Average Home Value in this Area
Purchase History
| Date | Buyer | Sale Price | Title Company |
|---|---|---|---|
| Williams Sophia G | -- | None Available | |
| Williams Oscar L | -- | Investors Title Company |
Source: Public Records
Mortgage History
| Date | Status | Borrower | Loan Amount |
|---|---|---|---|
| Closed | Williams Oscar L | $115,000 |
Source: Public Records
Tax History Compared to Growth
Tax History
| Year | Tax Paid | Tax Assessment Tax Assessment Total Assessment is a certain percentage of the fair market value that is determined by local assessors to be the total taxable value of land and additions on the property. | Land | Improvement |
|---|---|---|---|---|
| 2025 | $853 | $40,860 | $15,651 | $25,209 |
| 2024 | $853 | $40,060 | $15,345 | $24,715 |
| 2023 | $843 | $39,276 | $15,045 | $24,231 |
| 2022 | $815 | $38,506 | $14,750 | $23,756 |
| 2021 | $799 | $37,752 | $14,461 | $23,291 |
| 2019 | $782 | $36,634 | $14,033 | $22,601 |
| 2018 | $724 | $35,916 | $13,758 | $22,158 |
| 2016 | $680 | $34,524 | $13,225 | $21,299 |
| 2015 | $674 | $34,007 | $13,027 | $20,980 |
| 2014 | $689 | $33,342 | $12,772 | $20,570 |
Source: Public Records
Map
Nearby Homes
- 10648 Empire Dr
- 12385 Osborne St Unit 2
- 12330 Osborne St Unit 77
- 12360 Osborne St
- 12368 Osborne St Unit 1
- 12411 Osborne St Unit 106
- 12411 Osborne St Unit 2
- 12616 Terra Bella St
- 10808 De Haven Ave
- 12335 Osborne Place
- 12375 Osborne Place Unit 7
- 12349 Glamis St
- 10965 Glenoaks Blvd Unit 132
- 10965 Glenoaks Blvd Unit 61
- 10218 Bradley Ave
- 11044 Borden Ave
- 12418 Gain St
- 11030 Chivers Ave
- 11108 Norris Ave
- 10028 San Fernando Rd Unit 34
- 10621 Empire Dr
- 12442 Empire Place
- 12510 Chanute St
- 12500 Chanute St
- 12443 Empire Place
- 10624 Empire Dr
- 12438 Empire Place
- 12439 Empire Place
- 10620 Empire Dr
- 10630 Empire Dr
- 12434 Empire Place
- 10636 Empire Dr
- 12507 Chanute St
- 10641 Empire Dr
- 12513 Chanute St
- 12534 Chanute St
- 12519 Chanute St
- 10642 Empire Dr
- 12525 Chanute St
- 12540 Chanute St