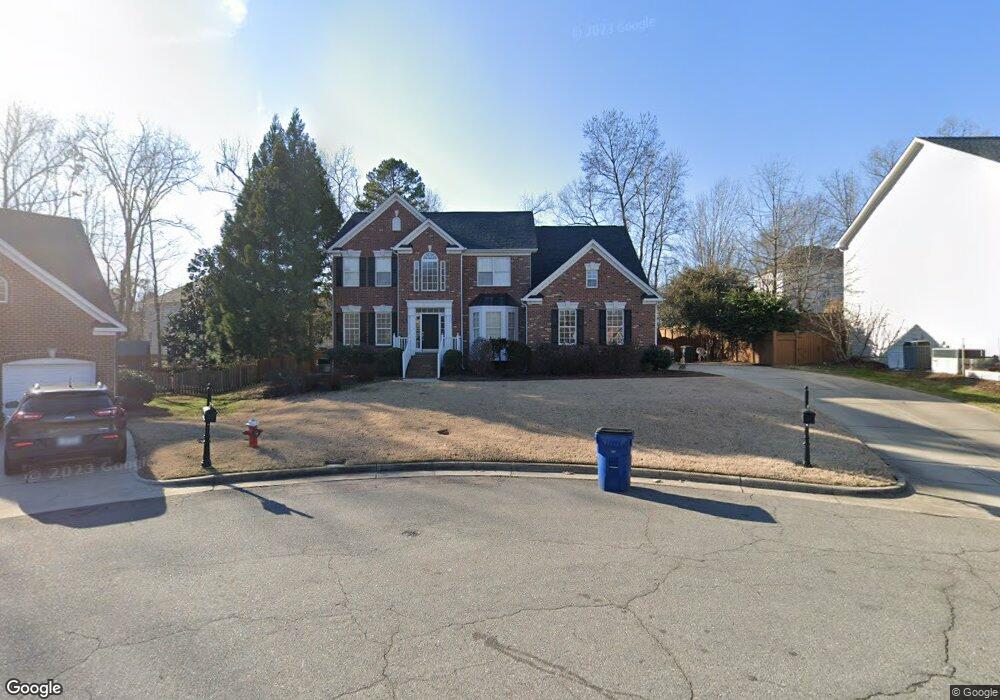
10605 Still Creek Ct Raleigh, NC 27614
Estimated Value: $647,000 - $757,000
4
Beds
3
Baths
3,100
Sq Ft
$229/Sq Ft
Est. Value
About This Home
This home is located at 10605 Still Creek Ct, Raleigh, NC 27614 and is currently estimated at $709,532, approximately $228 per square foot. 10605 Still Creek Ct is a home located in Wake County with nearby schools including Abbotts Creek Elementary School, Wakefield Middle, and Wakefield High School.
Ownership History
Date
Name
Owned For
Owner Type
Purchase Details
Closed on
Mar 29, 2015
Sold by
Peek Tracy G and Peek Joyce A
Bought by
Rankin John Paul and Rankin Jenna Marie
Current Estimated Value
Home Financials for this Owner
Home Financials are based on the most recent Mortgage that was taken out on this home.
Original Mortgage
$352,500
Interest Rate
3.92%
Mortgage Type
New Conventional
Purchase Details
Closed on
Oct 31, 2005
Sold by
Mcdonald Mark and Mcdonald Ginger
Bought by
Peck Tracy G and Peck Joyce A
Home Financials for this Owner
Home Financials are based on the most recent Mortgage that was taken out on this home.
Original Mortgage
$111,000
Interest Rate
5.71%
Mortgage Type
Fannie Mae Freddie Mac
Purchase Details
Closed on
Mar 1, 2001
Sold by
The Drees Company
Bought by
Mcdonald Mark and Mcdonald Ginger
Home Financials for this Owner
Home Financials are based on the most recent Mortgage that was taken out on this home.
Original Mortgage
$261,500
Interest Rate
7.02%
Create a Home Valuation Report for This Property
The Home Valuation Report is an in-depth analysis detailing your home's value as well as a comparison with similar homes in the area
Home Values in the Area
Average Home Value in this Area
Purchase History
| Date | Buyer | Sale Price | Title Company |
|---|---|---|---|
| Rankin John Paul | $375,000 | None Available | |
| Peck Tracy G | $354,000 | None Available | |
| Mcdonald Mark | $291,000 | -- |
Source: Public Records
Mortgage History
| Date | Status | Borrower | Loan Amount |
|---|---|---|---|
| Previous Owner | Rankin John Paul | $352,500 | |
| Previous Owner | Peck Tracy G | $111,000 | |
| Previous Owner | Mcdonald Mark | $261,500 |
Source: Public Records
Tax History Compared to Growth
Tax History
| Year | Tax Paid | Tax Assessment Tax Assessment Total Assessment is a certain percentage of the fair market value that is determined by local assessors to be the total taxable value of land and additions on the property. | Land | Improvement |
|---|---|---|---|---|
| 2025 | $5,802 | $662,978 | $175,000 | $487,978 |
| 2024 | $5,778 | $662,978 | $175,000 | $487,978 |
| 2023 | $4,702 | $429,575 | $100,000 | $329,575 |
| 2022 | $4,260 | $429,575 | $100,000 | $329,575 |
| 2021 | $4,010 | $410,053 | $100,000 | $310,053 |
| 2020 | $3,937 | $410,053 | $100,000 | $310,053 |
| 2019 | $4,386 | $376,763 | $80,000 | $296,763 |
| 2018 | $4,137 | $376,763 | $80,000 | $296,763 |
| 2017 | $3,939 | $376,763 | $80,000 | $296,763 |
| 2016 | $3,858 | $376,763 | $80,000 | $296,763 |
| 2015 | $3,947 | $379,282 | $80,000 | $299,282 |
| 2014 | -- | $379,282 | $80,000 | $299,282 |
Source: Public Records
Map
Nearby Homes
- 10415 Ashmead Ln
- 1700 Southwell Ct
- 4720 All Points View Way
- 4615 All Points View Way
- 1741 Farmington Grove Dr
- 10907 Flower Bed Ct
- 10205 Sorrills Creek Ln
- 2136 Dunn Rd
- 10904 Fitzwilliam St
- 4406 Crystal Breeze St
- 1804 Falls Landing Dr
- 1808 Falls Landing Dr
- 2051 Dunn Rd
- 1544 Nealstone Way
- 1911 Falls Landing Dr Unit 103
- 1911 Falls Landing Dr Unit 106
- 1505 October Rd
- 10621 Catara Dr
- 10209 River Bank Dr
- 10821 Farmville Rd
- 10609 Still Creek Ct
- 10601 Still Creek Ct
- 10600 Pride Rock Ct
- 10608 Silverwood Creek Dr
- 10604 Pride Rock Ct
- 10617 Still Creek Ct
- 10600 Silverwood Creek Dr
- 10608 Still Creek Ct
- 10600 Still Creek Ct
- 10612 Silverwood Creek Dr
- 10601 Pride Rock Ct
- 10612 Still Creek Ct
- 10604 Still Creek Ct
- 1816 Wescott Dr
- 1812 Wescott Dr
- 10601 Silverwood Creek Dr
- 1820 Wescott Dr
- 10616 Silverwood Creek Dr
- 10616 Still Creek Ct
- 10605 Pride Rock Ct