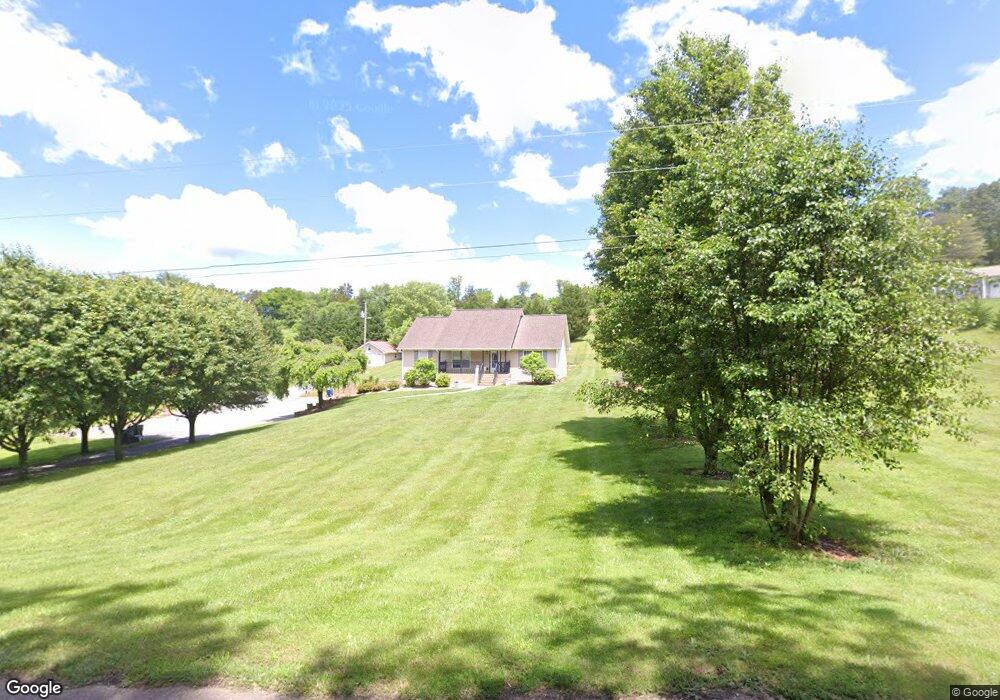
1061 Little Mountain Rd Russellville, TN 37860
Estimated Value: $282,141 - $354,000
--
Bed
2
Baths
1,440
Sq Ft
$219/Sq Ft
Est. Value
About This Home
This home is located at 1061 Little Mountain Rd, Russellville, TN 37860 and is currently estimated at $315,035, approximately $218 per square foot. 1061 Little Mountain Rd is a home located in Hamblen County with nearby schools including Russellville Elementary School, East Ridge Middle School, and Morristown East High School.
Ownership History
Date
Name
Owned For
Owner Type
Purchase Details
Closed on
Dec 30, 2008
Sold by
Robbins Jerry
Bought by
Butler Karen L
Current Estimated Value
Home Financials for this Owner
Home Financials are based on the most recent Mortgage that was taken out on this home.
Original Mortgage
$149,091
Outstanding Balance
$98,654
Interest Rate
5.48%
Estimated Equity
$216,381
Purchase Details
Closed on
Mar 17, 2008
Sold by
Robbins Construction Inc
Bought by
Robbins Jerry
Home Financials for this Owner
Home Financials are based on the most recent Mortgage that was taken out on this home.
Original Mortgage
$135,150
Interest Rate
5.68%
Purchase Details
Closed on
Jun 5, 2007
Bought by
Robbins Construction Inc
Purchase Details
Closed on
Oct 18, 1951
Bought by
Hurst Hurst G and Hurst Edna
Create a Home Valuation Report for This Property
The Home Valuation Report is an in-depth analysis detailing your home's value as well as a comparison with similar homes in the area
Home Values in the Area
Average Home Value in this Area
Purchase History
| Date | Buyer | Sale Price | Title Company |
|---|---|---|---|
| Butler Karen L | $149,900 | -- | |
| Robbins Jerry | -- | -- | |
| Robbins Construction Inc | $297,800 | -- | |
| Hurst Hurst G | -- | -- |
Source: Public Records
Mortgage History
| Date | Status | Borrower | Loan Amount |
|---|---|---|---|
| Closed | Hurst Hurst G | $0 | |
| Open | Hurst Hurst G | $149,091 | |
| Previous Owner | Hurst Hurst G | $135,150 |
Source: Public Records
Tax History Compared to Growth
Tax History
| Year | Tax Paid | Tax Assessment Tax Assessment Total Assessment is a certain percentage of the fair market value that is determined by local assessors to be the total taxable value of land and additions on the property. | Land | Improvement |
|---|---|---|---|---|
| 2024 | $840 | $42,625 | $4,675 | $37,950 |
| 2023 | $840 | $42,625 | $0 | $0 |
| 2022 | $840 | $42,625 | $4,675 | $37,950 |
| 2021 | $840 | $42,625 | $4,675 | $37,950 |
| 2020 | $761 | $42,625 | $4,675 | $37,950 |
| 2019 | $768 | $36,075 | $4,675 | $31,400 |
| 2018 | $768 | $36,075 | $4,675 | $31,400 |
| 2017 | $768 | $36,075 | $4,675 | $31,400 |
| 2016 | $718 | $36,075 | $4,675 | $31,400 |
| 2015 | $667 | $36,075 | $4,675 | $31,400 |
| 2014 | -- | $36,075 | $4,675 | $31,400 |
| 2013 | -- | $36,425 | $0 | $0 |
Source: Public Records
Map
Nearby Homes
- 5751 Charlene Dr
- 1290 Little Mountain Rd
- 1341 Little Mountain Rd
- 814 Pullen Rd
- 00 Shinbone E Sugar Hollow Rd
- Tract 3 Shinbone Rd
- Tract 4 Shinbone Rd
- 1976/1986 Shinbone Rd
- Tract 2 Shinbone Rd
- 1475 Shinbone Rd
- 6284 Old Russellville Pike
- 6563 E Andrew Johnson Hwy
- 6330 Old Russellville Pike
- 6650 E Andrew Johnson Hwy
- 5740 Dodson Ferry Rd
- 1041 Wilburn Rd
- 5790 N 2nd St
- 6421 Old Russellville Pike
- 233 Harvey Dr
- 1342 Slop Creek Rd
- 1059 Little Mountain Rd
- 1073 Little Mountain Rd
- 1053 Little Mountain Rd
- 1047 Little Mountain Rd
- 1070 Little Mountain Rd
- 1025 Little Mountain Rd
- 1091 Little Mountain Rd
- 5780 Kay Dr
- 5788 Kay Dr
- 5792 Kay Dr
- 5776 Kay Dr
- 1142 Warrensburg Rd
- 1138 Warrensburg Rd
- 5779 Kay Dr
- 5785 Kay Dr
- 5791 Charlene Dr
- 5791 Kay Dr
- 5773 Kay Dr
- 5799 Kay Dr
- 5781 Charlene Dr