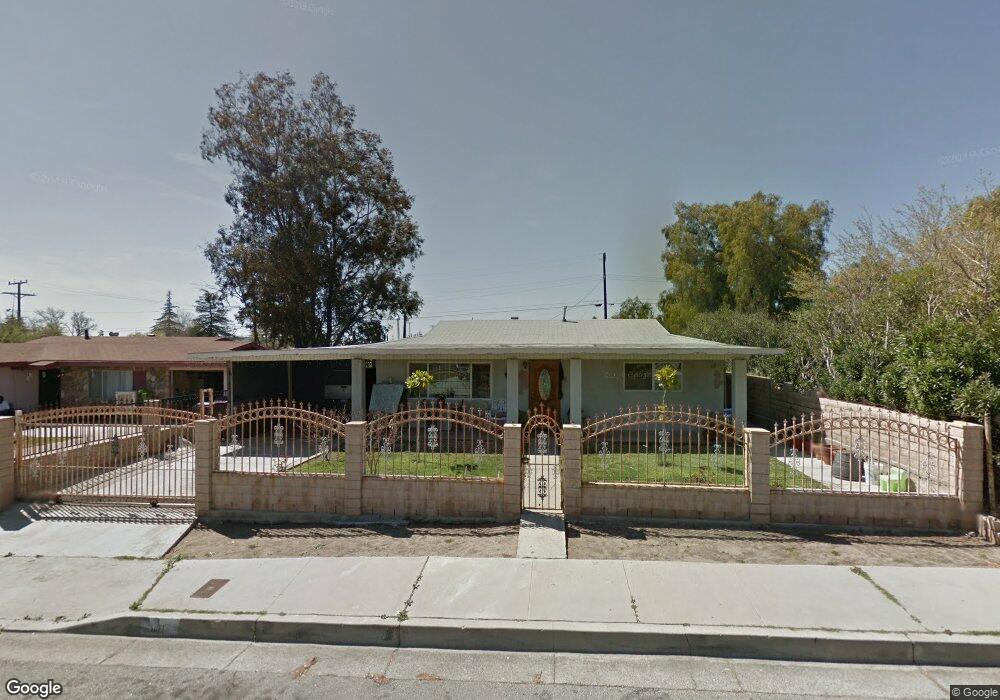
1061 N Cherry St Banning, CA 92220
Estimated Value: $265,000 - $380,000
2
Beds
1
Bath
925
Sq Ft
$355/Sq Ft
Est. Value
About This Home
This home is located at 1061 N Cherry St, Banning, CA 92220 and is currently estimated at $328,688, approximately $355 per square foot. 1061 N Cherry St is a home located in Riverside County with nearby schools including Banning High School.
Ownership History
Date
Name
Owned For
Owner Type
Purchase Details
Closed on
Jan 12, 2026
Sold by
Martinez Juan
Bought by
Juan Jose Martinez Flores Romelia Martinez Re and Flores
Current Estimated Value
Purchase Details
Closed on
Sep 28, 1993
Sold by
Martinez Romelia
Bought by
Martinez Juan
Home Financials for this Owner
Home Financials are based on the most recent Mortgage that was taken out on this home.
Original Mortgage
$50,933
Interest Rate
7.13%
Mortgage Type
FHA
Purchase Details
Closed on
Aug 25, 1993
Sold by
Bracy Jesse L and Bracy Carmen
Bought by
Martinez Juan
Home Financials for this Owner
Home Financials are based on the most recent Mortgage that was taken out on this home.
Original Mortgage
$50,933
Interest Rate
7.13%
Mortgage Type
FHA
Create a Home Valuation Report for This Property
The Home Valuation Report is an in-depth analysis detailing your home's value as well as a comparison with similar homes in the area
Home Values in the Area
Average Home Value in this Area
Purchase History
| Date | Buyer | Sale Price | Title Company |
|---|---|---|---|
| Juan Jose Martinez Flores Romelia Martinez Re | -- | None Listed On Document | |
| Martinez Juan | -- | Orange Coast Title Co | |
| Martinez Juan | $50,000 | Orange Coast Title Co |
Source: Public Records
Mortgage History
| Date | Status | Borrower | Loan Amount |
|---|---|---|---|
| Previous Owner | Martinez Juan | $50,933 |
Source: Public Records
Tax History
| Year | Tax Paid | Tax Assessment Tax Assessment Total Assessment is a certain percentage of the fair market value that is determined by local assessors to be the total taxable value of land and additions on the property. | Land | Improvement |
|---|---|---|---|---|
| 2025 | $978 | $67,938 | $16,970 | $50,968 |
| 2023 | $978 | $65,302 | $16,312 | $48,990 |
| 2022 | $958 | $64,023 | $15,993 | $48,030 |
| 2021 | $941 | $62,769 | $15,680 | $47,089 |
| 2020 | $931 | $62,127 | $15,520 | $46,607 |
| 2019 | $917 | $60,910 | $15,216 | $45,694 |
| 2018 | $910 | $59,717 | $14,918 | $44,799 |
| 2017 | $894 | $58,547 | $14,626 | $43,921 |
| 2016 | $852 | $57,400 | $14,340 | $43,060 |
| 2015 | $840 | $56,540 | $14,126 | $42,414 |
| 2014 | $834 | $55,434 | $13,850 | $41,584 |
Source: Public Records
Map
Nearby Homes
- 1308 N Phillips St
- 0 N Blanchard St
- 906 N Allen St
- 1294 N Blanchard St
- 0 N Almond Way Unit IG25103642
- 755 N Allen St
- 1291 N Almond Way
- 0 N Hargrave St Unit IV26013127
- 1264 N Hargrave St
- 685 N Allen St
- 1508 N Almond Way
- 1058 N Hermosa Ave
- 1469 E George St
- 1130 E George St
- 582 N Almond Way
- 1485 N Hargrave St
- 720 E George St
- 660 N Florida St
- 531 N Hargrave St
- 1106 N Durward St
- 1021 N Cherry St
- 1099 N Cherry St
- 1231 E Hoffer St
- 1211 E Hoffer St
- 1111 N Cherry St
- 1048 N Cherry St
- 1078 N Cherry St
- 1279 E Hoffer St
- 1096 N Cherry St
- 1114 N Cherry St
- 1230 E Hoffer St
- 1163 N Cherry St
- 980 N Cherry St
- 1154 N Cherry St
- 962 N Cherry St
- 1160 N Cherry St
- 1187 N Cherry St
- 963 N Cherry St
- 985 N Allen St
- 961 N Cherry St
Your Personal Tour Guide
Ask me questions while you tour the home.