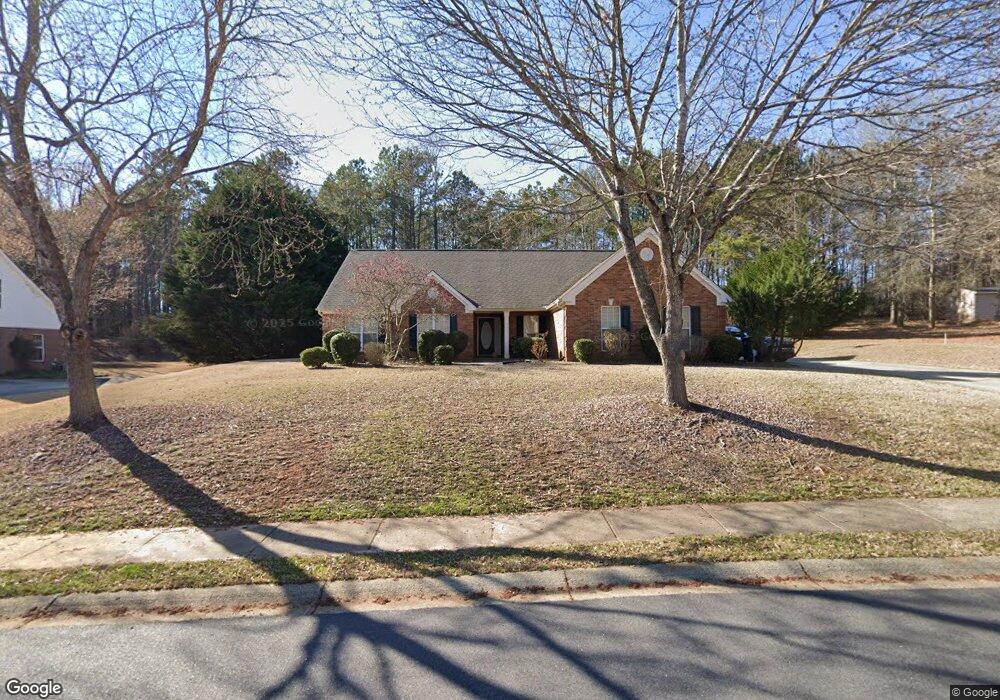
1061 Roberta Dr Bishop, GA 30621
Estimated Value: $465,000 - $530,000
4
Beds
3
Baths
2,293
Sq Ft
$215/Sq Ft
Est. Value
About This Home
This home is located at 1061 Roberta Dr, Bishop, GA 30621 and is currently estimated at $492,810, approximately $214 per square foot. 1061 Roberta Dr is a home located in Oconee County with nearby schools including High Shoals Elementary School, Oconee County Middle School, and Oconee County High School.
Ownership History
Date
Name
Owned For
Owner Type
Purchase Details
Closed on
Jul 24, 2012
Sold by
Wang Mingliang
Bought by
Wang Mingliang and Wang Jing Hong
Current Estimated Value
Purchase Details
Closed on
Sep 19, 2006
Sold by
Not Provided
Bought by
Kennedy Marvin A and Kennedy Michelle P
Home Financials for this Owner
Home Financials are based on the most recent Mortgage that was taken out on this home.
Original Mortgage
$145,000
Interest Rate
6.46%
Mortgage Type
New Conventional
Purchase Details
Closed on
Dec 10, 2004
Sold by
Rpm Home Builders Llc
Bought by
Adams Brett W
Home Financials for this Owner
Home Financials are based on the most recent Mortgage that was taken out on this home.
Original Mortgage
$157,500
Interest Rate
6.38%
Mortgage Type
New Conventional
Purchase Details
Closed on
Aug 27, 2003
Sold by
Rolling Glen Llc
Bought by
Rpm Home Builders Llc
Create a Home Valuation Report for This Property
The Home Valuation Report is an in-depth analysis detailing your home's value as well as a comparison with similar homes in the area
Purchase History
| Date | Buyer | Sale Price | Title Company |
|---|---|---|---|
| Wang Mingliang | -- | -- | |
| Wang Mingliang | $180,000 | -- | |
| Wang Mingliang | $180,000 | -- | |
| Kennedy Marvin A | $215,000 | -- | |
| Adams Brett W | $196,900 | -- | |
| Adams Brett W | $196,900 | -- | |
| Rpm Home Builders Llc | $340,000 | -- |
Source: Public Records
Mortgage History
| Date | Status | Borrower | Loan Amount |
|---|---|---|---|
| Previous Owner | Kennedy Marvin A | $145,000 | |
| Previous Owner | Adams Brett W | $157,500 |
Source: Public Records
Tax History
| Year | Tax Paid | Tax Assessment Tax Assessment Total Assessment is a certain percentage of the fair market value that is determined by local assessors to be the total taxable value of land and additions on the property. | Land | Improvement |
|---|---|---|---|---|
| 2025 | $3,172 | $183,512 | $32,000 | $151,512 |
| 2024 | $3,172 | $150,903 | $26,000 | $124,903 |
| 2023 | $2,852 | $126,679 | $20,000 | $106,679 |
| 2022 | $2,432 | $112,112 | $20,000 | $92,112 |
| 2021 | $2,404 | $102,840 | $20,000 | $82,840 |
| 2020 | $2,287 | $97,614 | $20,000 | $77,614 |
| 2019 | $2,173 | $92,726 | $16,000 | $76,726 |
| 2018 | $2,186 | $91,358 | $16,000 | $75,358 |
| 2017 | $2,042 | $85,267 | $16,000 | $69,267 |
| 2016 | $1,904 | $79,436 | $14,000 | $65,436 |
| 2015 | $1,886 | $78,592 | $14,000 | $64,592 |
| 2014 | $1,855 | $75,563 | $14,000 | $61,563 |
| 2013 | -- | $66,826 | $14,000 | $52,826 |
Source: Public Records
Map
Nearby Homes
- 1150 Glen Ln
- 1171 Spring Lake Dr
- 6534 Whitlow Creek Dr
- 4662 Whitlow Ridge Dr
- 1031 Spring Lake Dr
- 2893 Whitlow Ridge Dr
- 1321 Cemetery Rd
- 3511 New High Shoals Rd
- 2161 Union Church Rd
- 2037 Boulder Ridge Ln
- 1858 Boulder Ridge Ln
- 1698 Shoal Creek Way
- 2012 Shoal Creek Way
- 1080 Oak Ridge Ct
- 1141 Southwind Dr
- 1011 Sharon Place
- 1295 Stonewood Field Rd
- 1025 Stonewood Field Rd
- 1364 Old Bishop Rd
- 1051 Roberta Dr
- 1081 Roberta Dr
- 1041 Roberta Dr
- 1061 Glen Ln
- 1071 Glen Ln
- 1060 Roberta Dr
- 1051 Glen Ln
- 1050 Roberta Dr
- 1080 Roberta Dr
- 1101 Roberta Dr
- 1081 Glen Ln
- 1031 Roberta Dr
- 1121 Roberta Dr
- 1031 Glen Ln
- 1090 Roberta Dr
- 1011 Glen Ln
- 1091 Glen Ln
- 1011 Roberta Dr
- 1070 Glen Ln
- 1210 Rolling Glen Dr
Your Personal Tour Guide
Ask me questions while you tour the home.