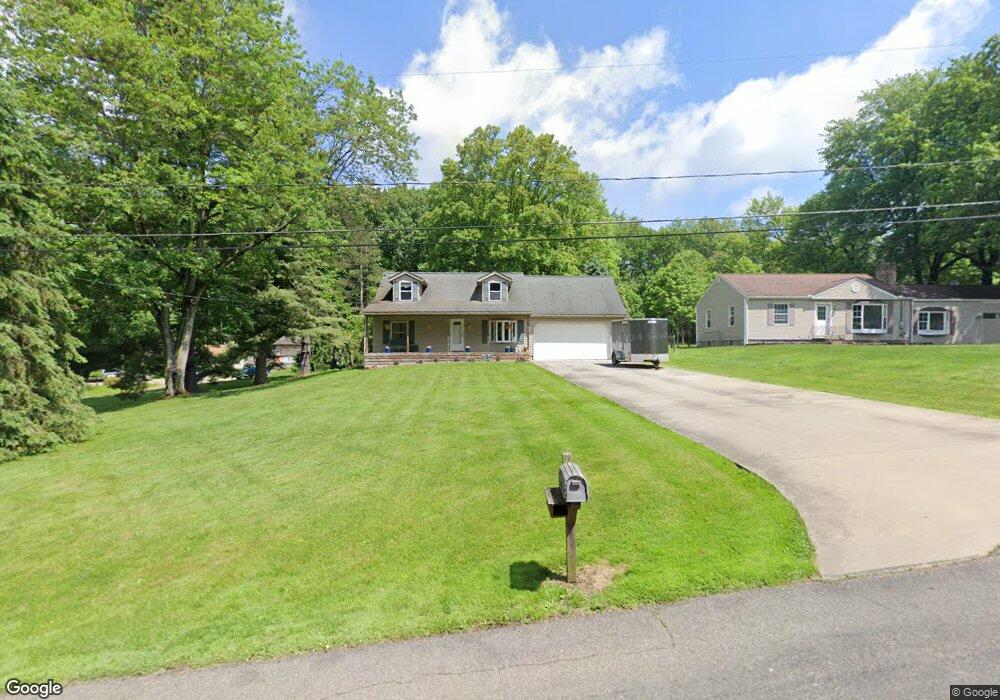
1061 Stump Rd New Franklin, OH 44319
Estimated Value: $214,000 - $247,448
3
Beds
2
Baths
1,220
Sq Ft
$194/Sq Ft
Est. Value
About This Home
This home is located at 1061 Stump Rd, New Franklin, OH 44319 and is currently estimated at $236,612, approximately $193 per square foot. 1061 Stump Rd is a home located in Summit County with nearby schools including St. Francis de Sales School.
Ownership History
Date
Name
Owned For
Owner Type
Purchase Details
Closed on
Apr 23, 2012
Sold by
Stock David A and Stock Ramona L
Bought by
Stock David A and Stock Ramona L
Current Estimated Value
Purchase Details
Closed on
Mar 25, 2005
Sold by
Stock David A
Bought by
Stock David A and Stock Ramona L
Home Financials for this Owner
Home Financials are based on the most recent Mortgage that was taken out on this home.
Original Mortgage
$160,000
Outstanding Balance
$98,371
Interest Rate
8.99%
Mortgage Type
Fannie Mae Freddie Mac
Estimated Equity
$138,241
Purchase Details
Closed on
Apr 1, 2000
Sold by
Pierson Steven L and Pierson Tamara
Bought by
Stock David A
Home Financials for this Owner
Home Financials are based on the most recent Mortgage that was taken out on this home.
Original Mortgage
$97,750
Interest Rate
8.31%
Create a Home Valuation Report for This Property
The Home Valuation Report is an in-depth analysis detailing your home's value as well as a comparison with similar homes in the area
Home Values in the Area
Average Home Value in this Area
Purchase History
| Date | Buyer | Sale Price | Title Company |
|---|---|---|---|
| Stock David A | -- | First Security Tile | |
| Stock David A | -- | Bankers Title | |
| Stock David A | $102,900 | Approved Statewide Title Age |
Source: Public Records
Mortgage History
| Date | Status | Borrower | Loan Amount |
|---|---|---|---|
| Open | Stock David A | $160,000 | |
| Closed | Stock David A | $97,750 |
Source: Public Records
Tax History Compared to Growth
Tax History
| Year | Tax Paid | Tax Assessment Tax Assessment Total Assessment is a certain percentage of the fair market value that is determined by local assessors to be the total taxable value of land and additions on the property. | Land | Improvement |
|---|---|---|---|---|
| 2025 | $3,539 | $70,868 | $12,768 | $58,100 |
| 2024 | $3,539 | $70,868 | $12,768 | $58,100 |
| 2023 | $3,539 | $70,868 | $12,768 | $58,100 |
| 2022 | $3,425 | $53,425 | $9,531 | $43,894 |
| 2021 | $3,437 | $53,425 | $9,531 | $43,894 |
| 2020 | $3,377 | $53,420 | $9,530 | $43,890 |
| 2019 | $2,730 | $38,650 | $10,480 | $28,170 |
| 2018 | $2,356 | $38,650 | $10,480 | $28,170 |
| 2017 | $2,353 | $38,650 | $10,480 | $28,170 |
| 2016 | $2,326 | $35,020 | $10,480 | $24,540 |
| 2015 | $2,353 | $35,020 | $10,480 | $24,540 |
| 2014 | $2,336 | $35,020 | $10,480 | $24,540 |
| 2013 | $2,337 | $35,230 | $10,480 | $24,750 |
Source: Public Records
Map
Nearby Homes
- 6090 Manchester Rd Unit 6096
- 6387 Hampsher Rd
- 781 Leeman Dr
- 715 Highland Park Dr
- 5983 Weaver Rd
- 451 Yager Rd
- 6407 Southview Dr
- 0 W Comet Rd Unit 5079117
- 7060 Manchester Rd
- 4851 Manchester Rd
- S/L 14,15 Shakes Hotel Dr
- 8714 Greenmeadow Ave NW
- 4698 Manchester Rd
- 0 Babst Ave NW
- 6 Shrakes Hotel Dr
- 4 Shrakes Hotel Dr
- 7 Shrakes Hotel Dr
- 5 Shrakes Hotel Dr
- 3 Shrakes Hotel Dr
- 4881 S Main St