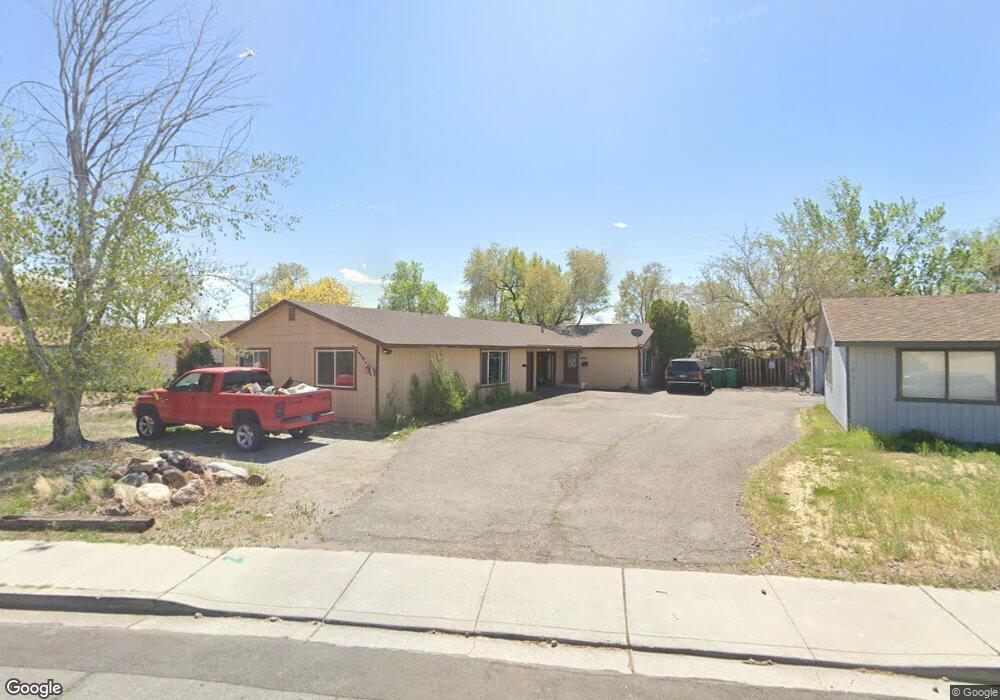
1061 Tyler Way Sparks, NV 89431
North Rock NeighborhoodEstimated Value: $453,048 - $591,000
4
Beds
4
Baths
1,768
Sq Ft
$309/Sq Ft
Est. Value
About This Home
This home is located at 1061 Tyler Way, Sparks, NV 89431 and is currently estimated at $545,512, approximately $308 per square foot. 1061 Tyler Way is a home located in Washoe County with nearby schools including Alice Maxwell Elementary School, Sparks Middle School, and Sparks High School.
Ownership History
Date
Name
Owned For
Owner Type
Purchase Details
Closed on
May 21, 2020
Sold by
Ruckman Jason M and Ruckman Amie M
Bought by
Stokes Warren K
Current Estimated Value
Home Financials for this Owner
Home Financials are based on the most recent Mortgage that was taken out on this home.
Original Mortgage
$284,000
Outstanding Balance
$251,663
Interest Rate
3.3%
Mortgage Type
New Conventional
Estimated Equity
$293,849
Purchase Details
Closed on
Oct 19, 2016
Sold by
Hapgood Aaron Wade
Bought by
Ruckman Jason M and Ruckman Amie M
Home Financials for this Owner
Home Financials are based on the most recent Mortgage that was taken out on this home.
Original Mortgage
$202,500
Interest Rate
3.5%
Mortgage Type
New Conventional
Purchase Details
Closed on
Dec 13, 2012
Sold by
Walker Aaryn and Walker Vestee
Bought by
Hapgood Aaron Wade
Purchase Details
Closed on
Dec 7, 2012
Sold by
Serps Family Lp
Bought by
Hapgood Aaron Wade
Purchase Details
Closed on
Jun 3, 1998
Sold by
Schiller William E
Bought by
The Serps Family Ltd Partnership
Create a Home Valuation Report for This Property
The Home Valuation Report is an in-depth analysis detailing your home's value as well as a comparison with similar homes in the area
Home Values in the Area
Average Home Value in this Area
Purchase History
| Date | Buyer | Sale Price | Title Company |
|---|---|---|---|
| Stokes Warren K | $355,000 | Ticor Title Reno | |
| Ruckman Jason M | $272,500 | First Centennial Reno | |
| Hapgood Aaron Wade | -- | None Available | |
| Hapgood Aaron Wade | $125,000 | None Available | |
| The Serps Family Ltd Partnership | -- | -- |
Source: Public Records
Mortgage History
| Date | Status | Borrower | Loan Amount |
|---|---|---|---|
| Open | Stokes Warren K | $284,000 | |
| Previous Owner | Ruckman Jason M | $202,500 |
Source: Public Records
Tax History Compared to Growth
Tax History
| Year | Tax Paid | Tax Assessment Tax Assessment Total Assessment is a certain percentage of the fair market value that is determined by local assessors to be the total taxable value of land and additions on the property. | Land | Improvement |
|---|---|---|---|---|
| 2025 | $1,633 | $67,982 | $43,365 | $24,617 |
| 2024 | $1,633 | $66,762 | $40,635 | $26,127 |
| 2023 | $1,092 | $65,063 | $41,510 | $23,553 |
| 2022 | $1,470 | $54,154 | $33,355 | $20,799 |
| 2021 | $1,362 | $48,851 | $27,615 | $21,236 |
| 2020 | $1,282 | $48,283 | $26,530 | $21,753 |
| 2019 | $1,221 | $43,916 | $22,470 | $21,446 |
| 2018 | $1,182 | $36,565 | $15,190 | $21,375 |
| 2017 | $1,137 | $35,564 | $14,000 | $21,564 |
| 2016 | $1,109 | $33,547 | $11,200 | $22,347 |
| 2015 | $1,108 | $31,203 | $8,050 | $23,153 |
| 2014 | $1,075 | $29,335 | $7,000 | $22,335 |
| 2013 | -- | $28,397 | $6,160 | $22,237 |
Source: Public Records
Map
Nearby Homes
- 1003 Sbragia Way
- 1124 Sbragia Way
- 1121 Greenbrae Dr
- 1705 9th St
- 1365 Prospect Ave
- 1110 Xman Way
- 1160 York Way
- 2154 Oppio St
- 1655 Byrd Dr
- 985 10th St
- 1345 Plymouth Way
- 1010 12th St
- 1125 Dodson Way
- 1595 York Way
- 1945 4th St Unit 32
- 1945 4th St Unit 33
- 1945 4th St Unit 10
- 1527 Steven Ct
- 1536 Irene Way
- 1560 Steven Ct Unit 2
- 1057 Holman Cir
- 1057 Holman Cir
- 1057 Holman Cir Unit NV
- 1071 & 1073 Tyler Way
- 1071 Holman Cir
- 1010 Sbragia Way
- 1047 Holman Cir
- 1012 Sbragia Way
- 1049 Holman Cir
- 1008 Sbragia Way
- 1882 11th St
- 1044 Holman Cir
- 1802 11th St
- 1006 Sbragia Way
- 1037 Holman Cir
- 1070 Tyler Way
- 1004 Sbragia Way
- 1050 Tyler Way
- 1027 Holman Cir