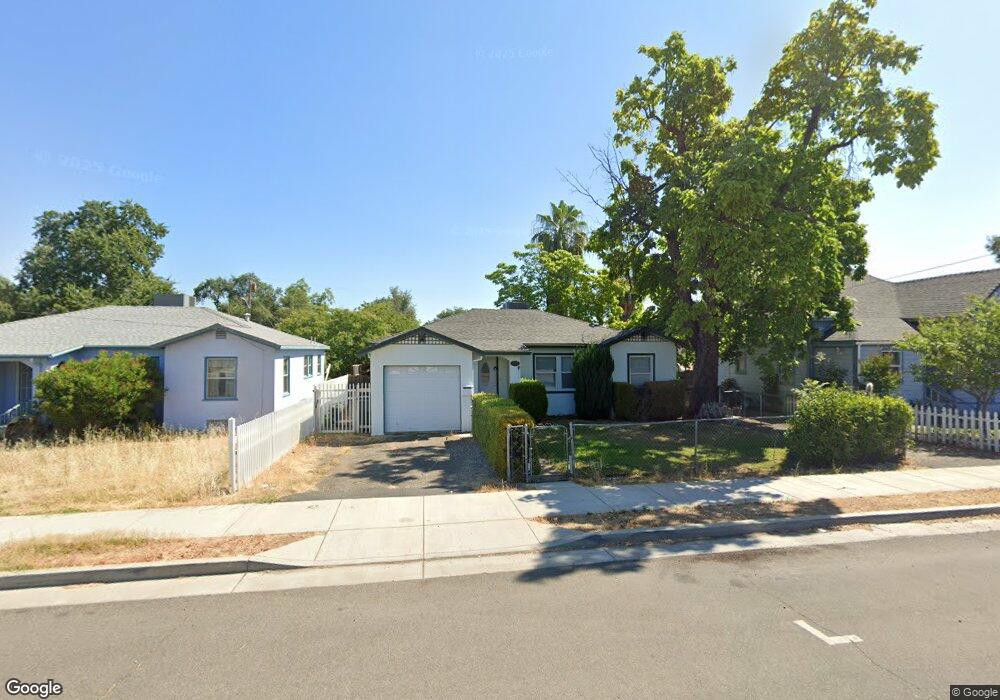
1061 West St Redding, CA 96001
Lakeview NeighborhoodEstimated Value: $228,000 - $301,000
3
Beds
2
Baths
1,232
Sq Ft
$217/Sq Ft
Est. Value
About This Home
This home is located at 1061 West St, Redding, CA 96001 and is currently estimated at $267,205, approximately $216 per square foot. 1061 West St is a home located in Shasta County with nearby schools including Manzanita Elementary School, Sequoia Middle School, and Shasta High School.
Ownership History
Date
Name
Owned For
Owner Type
Purchase Details
Closed on
Apr 15, 2019
Sold by
Scoty David L and Scott David L
Bought by
Scott David L and David L Scott Revocable Trust
Current Estimated Value
Purchase Details
Closed on
Apr 19, 2017
Sold by
Scott Beverly A and Scott David L
Bought by
Scott David L
Home Financials for this Owner
Home Financials are based on the most recent Mortgage that was taken out on this home.
Original Mortgage
$171,200
Outstanding Balance
$142,464
Interest Rate
4.21%
Mortgage Type
New Conventional
Estimated Equity
$124,741
Purchase Details
Closed on
Jun 22, 2006
Sold by
Scott Beverly A and Scott David L
Bought by
Scott Beverly A and Scott David L
Create a Home Valuation Report for This Property
The Home Valuation Report is an in-depth analysis detailing your home's value as well as a comparison with similar homes in the area
Home Values in the Area
Average Home Value in this Area
Purchase History
| Date | Buyer | Sale Price | Title Company |
|---|---|---|---|
| Scott David L | -- | None Available | |
| Scott David L | $20,000 | First American Title Company | |
| Scott Beverly A | -- | None Available |
Source: Public Records
Mortgage History
| Date | Status | Borrower | Loan Amount |
|---|---|---|---|
| Open | Scott David L | $171,200 |
Source: Public Records
Tax History
| Year | Tax Paid | Tax Assessment Tax Assessment Total Assessment is a certain percentage of the fair market value that is determined by local assessors to be the total taxable value of land and additions on the property. | Land | Improvement |
|---|---|---|---|---|
| 2025 | $1,904 | $189,342 | $40,654 | $148,688 |
| 2024 | $1,873 | $185,630 | $39,857 | $145,773 |
| 2023 | $1,873 | $181,991 | $39,076 | $142,915 |
| 2022 | $1,840 | $178,423 | $38,310 | $140,113 |
| 2021 | $1,829 | $174,925 | $37,559 | $137,366 |
| 2020 | $1,852 | $173,132 | $37,174 | $135,958 |
| 2019 | $1,757 | $169,739 | $36,446 | $133,293 |
| 2018 | $1,772 | $166,412 | $35,732 | $130,680 |
| 2017 | $1,490 | $138,700 | $25,000 | $113,700 |
| 2016 | $1,322 | $125,000 | $25,000 | $100,000 |
| 2015 | $1,105 | $105,000 | $25,000 | $80,000 |
| 2014 | $986 | $93,000 | $25,000 | $68,000 |
Source: Public Records
Map
Nearby Homes
- 1129 Magnolia Ave
- 2255 North St
- 1170 Orange Ave
- 1010 California St
- 2351 Eureka Way
- 1465 Riverside Dr
- 2315 Butte St
- 2327 Butte St
- 2036 Placer St
- 1523 Olive Ave
- 2565 North St
- 1545 Olive Ave
- 1777 Magnolia Ave
- 0 California St Unit 25-5331
- 3024 West St
- 2381/2401 West St
- 2330 West St
- 1834 Del Mar Ave
- 1830 Del Mar Ave
- 416 Arbor Place
Your Personal Tour Guide
Ask me questions while you tour the home.