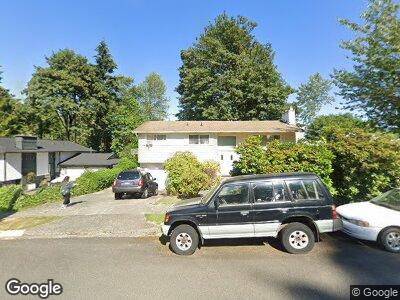
10612 171st Ave NE Redmond, WA 98052
Education Hill NeighborhoodEstimated Value: $1,013,000 - $1,359,000
4
Beds
3
Baths
1,980
Sq Ft
$631/Sq Ft
Est. Value
About This Home
This home is located at 10612 171st Ave NE, Redmond, WA 98052 and is currently estimated at $1,249,852, approximately $631 per square foot. 10612 171st Ave NE is a home located in King County with nearby schools including Mann Elementary, Redmond Middle School, and Redmond High School.
Ownership History
Date
Name
Owned For
Owner Type
Purchase Details
Closed on
Apr 18, 2001
Sold by
Kaplan Graciela
Bought by
Kaplan Elias
Current Estimated Value
Home Financials for this Owner
Home Financials are based on the most recent Mortgage that was taken out on this home.
Original Mortgage
$216,855
Interest Rate
6.98%
Purchase Details
Closed on
Apr 17, 2001
Sold by
Holtz Darrell B and Holtz Patricia A
Bought by
Kaplan Elias
Home Financials for this Owner
Home Financials are based on the most recent Mortgage that was taken out on this home.
Original Mortgage
$216,855
Interest Rate
6.98%
Purchase Details
Closed on
Apr 22, 1994
Sold by
Gertsch Dean A and Gertsch Diane E
Bought by
Holtz Darrell B and Holtz Patricia A
Home Financials for this Owner
Home Financials are based on the most recent Mortgage that was taken out on this home.
Original Mortgage
$147,240
Interest Rate
7.79%
Mortgage Type
FHA
Create a Home Valuation Report for This Property
The Home Valuation Report is an in-depth analysis detailing your home's value as well as a comparison with similar homes in the area
Home Values in the Area
Average Home Value in this Area
Purchase History
| Date | Buyer | Sale Price | Title Company |
|---|---|---|---|
| Kaplan Elias | -- | Washington Title | |
| Kaplan Elias | $240,950 | Washington Title | |
| Holtz Darrell B | $154,000 | -- |
Source: Public Records
Mortgage History
| Date | Status | Borrower | Loan Amount |
|---|---|---|---|
| Open | Kaplan Elias | $294,978 | |
| Closed | Kaplan Elias | $310,000 | |
| Closed | Kaplan Elias | $100,000 | |
| Closed | Kaplan Elias | $216,855 | |
| Previous Owner | Holtz Darrell B | $147,240 |
Source: Public Records
Tax History Compared to Growth
Tax History
| Year | Tax Paid | Tax Assessment Tax Assessment Total Assessment is a certain percentage of the fair market value that is determined by local assessors to be the total taxable value of land and additions on the property. | Land | Improvement |
|---|---|---|---|---|
| 2024 | $7,520 | $956,000 | $665,000 | $291,000 |
| 2023 | $6,931 | $837,000 | $565,000 | $272,000 |
| 2022 | $6,284 | $1,043,000 | $708,000 | $335,000 |
| 2021 | $5,795 | $730,000 | $496,000 | $234,000 |
| 2020 | $5,899 | $622,000 | $423,000 | $199,000 |
| 2018 | $5,249 | $577,000 | $335,000 | $242,000 |
| 2017 | $4,389 | $525,000 | $309,000 | $216,000 |
| 2016 | $4,265 | $458,000 | $278,000 | $180,000 |
| 2015 | $4,059 | $441,000 | $269,000 | $172,000 |
| 2014 | -- | $405,000 | $250,000 | $155,000 |
| 2013 | -- | $338,000 | $219,000 | $119,000 |
Source: Public Records
Map
Nearby Homes
- 17709 NE 108th Way
- 10718 165th Place NE
- 11217 167th Ct NE
- 16411 NE 111th St
- 11408 174th Ave NE
- 11586 174th Ct NE
- 11518 167th Place NE
- 16430 NE 99th St
- 17030 NE 95th St
- 0 113th St E Unit IV24113249
- 16152 NE 112th St
- 10614 184th Ave NE
- 11846 173rd Place NE
- 16420 NE 96th Place
- 9630 178th Place NE Unit 2
- 10909 Avondale Rd NE Unit R170
- 9309 177th Place NE Unit 3
- 11135 159th Ave NE
- 17288 NE 120th Way
- 9630 161st Ave NE
- 10612 171st Ave NE
- 10608 171st Ave NE
- 10616 171st Ave NE
- 17104 NE 106th St
- 10620 171st Ave NE
- 10611 171st Ave NE
- 17026 NE 106th St
- 10619 171st Ave NE
- 156 XX NE 106th St
- 10624 171st Ave NE
- 10606 171st Ct NE
- 17022 NE 106th St
- 10602 171st Ct NE
- 17105 NE 106th St
- 10610 171st Ct NE
- 17101 NE 106th St
- 17032 NE 107th St
- 17027 NE 106th St
- 17018 NE 106th St