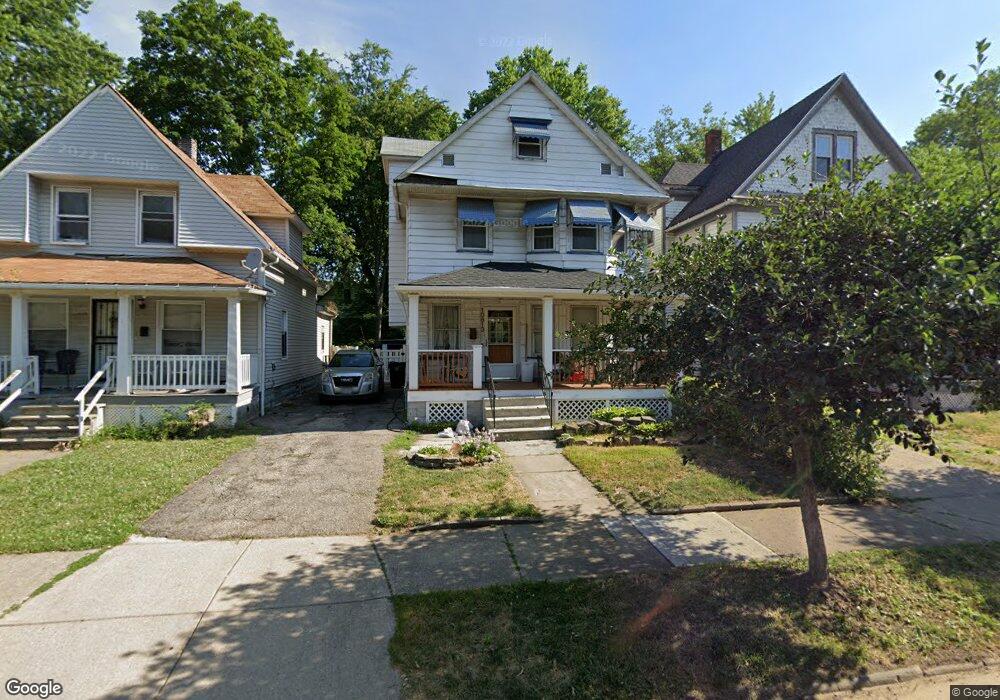
10613 Englewood Ave Cleveland, OH 44108
Glenville NeighborhoodEstimated Value: $67,000 - $93,000
5
Beds
1
Bath
1,272
Sq Ft
$58/Sq Ft
Est. Value
About This Home
This home is located at 10613 Englewood Ave, Cleveland, OH 44108 and is currently estimated at $74,048, approximately $58 per square foot. 10613 Englewood Ave is a home located in Cuyahoga County with nearby schools including Bolton, Anton Grdina School, and Andrew J. Rickoff School.
Ownership History
Date
Name
Owned For
Owner Type
Purchase Details
Closed on
Sep 18, 1998
Sold by
Hall Stephon S
Bought by
Mayhand Michelle
Current Estimated Value
Purchase Details
Closed on
Sep 1, 1998
Sold by
Allen Diana R and Vernon Allen
Bought by
Hall Stephon S
Purchase Details
Closed on
Mar 17, 1994
Sold by
Allen Diana R Fka
Bought by
Allen Diana R
Purchase Details
Closed on
Oct 13, 1993
Sold by
Scott Diana D
Bought by
Allen Diana R Fka
Purchase Details
Closed on
Oct 12, 1990
Bought by
Scott Diana D
Purchase Details
Closed on
Oct 10, 1990
Sold by
Scott Diana
Bought by
High Point Properties, Inc
Purchase Details
Closed on
Jun 15, 1989
Sold by
Scott James
Bought by
Scott Diana
Purchase Details
Closed on
Feb 9, 1984
Sold by
Scott James
Bought by
Scott James
Purchase Details
Closed on
Sep 17, 1980
Sold by
Scott James and Scott Parrie L
Bought by
Scott James
Purchase Details
Closed on
Jan 1, 1975
Bought by
Scott James and Scott Parrie L
Create a Home Valuation Report for This Property
The Home Valuation Report is an in-depth analysis detailing your home's value as well as a comparison with similar homes in the area
Home Values in the Area
Average Home Value in this Area
Purchase History
| Date | Buyer | Sale Price | Title Company |
|---|---|---|---|
| Mayhand Michelle | -- | -- | |
| Hall Stephon S | $2,000 | -- | |
| Allen Diana R | -- | -- | |
| Allen Diana R Fka | $8,400 | -- | |
| Scott Diana D | $16,800 | -- | |
| High Point Properties, Inc | $15,600 | -- | |
| Scott Diana | -- | -- | |
| Scott James | -- | -- | |
| Scott James | -- | -- | |
| Scott James | -- | -- |
Source: Public Records
Tax History Compared to Growth
Tax History
| Year | Tax Paid | Tax Assessment Tax Assessment Total Assessment is a certain percentage of the fair market value that is determined by local assessors to be the total taxable value of land and additions on the property. | Land | Improvement |
|---|---|---|---|---|
| 2024 | $402 | $15,925 | $2,765 | $13,160 |
| 2023 | -- | $8,680 | $1,540 | $7,140 |
| 2022 | $0 | $8,680 | $1,540 | $7,140 |
| 2021 | $0 | $8,680 | $1,540 | $7,140 |
| 2020 | $0 | $7,110 | $1,260 | $5,850 |
| 2019 | $687 | $20,300 | $3,600 | $16,700 |
| 2018 | $0 | $7,110 | $1,260 | $5,850 |
| 2017 | $0 | $5,710 | $770 | $4,940 |
| 2016 | $0 | $5,710 | $770 | $4,940 |
| 2015 | -- | $5,710 | $770 | $4,940 |
| 2014 | -- | $6,340 | $840 | $5,500 |
Source: Public Records
Map
Nearby Homes
- 10721 Englewood Ave
- 769 E 103rd St
- 10703 Kimberley Ave
- 786 Parkwood Dr
- 10413 Yale Ave
- 10525 Gooding Ave
- 735 Parkwood Dr
- 10523 Helena Ave
- 666 Parkwood Dr
- 10713 Gooding Ave
- 742 Linn Dr
- 10328 Empire Ave
- 10100 Yale Ave
- 9902 Garfield Ave
- 10515 Greenlawn Ave
- 10003 Empire Ave
- 10321 Kempton Ave
- 10009 Parmelee Ave
- 11109 Greenview Ave
- 10307 Marlowe Ave
- 10615 Englewood Ave
- 10609 Englewood Ave
- 10619 Englewood Ave
- 10605 Englewood Ave
- 10623 Englewood Ave
- 10612 Everton Ave
- 10608 Everton Ave
- 10531 Englewood Ave
- 10625 Englewood Ave
- 10600 Everton Ave
- 10622 Everton Ave
- 10612 Englewood Ave
- 10614 Englewood Ave
- 10608 Englewood Ave
- 10618 Englewood Ave
- 10606 Englewood Ave
- 10527 Englewood Ave
- 10532 Everton Ave
- 10631 Englewood Ave
- 10622 Englewood Ave