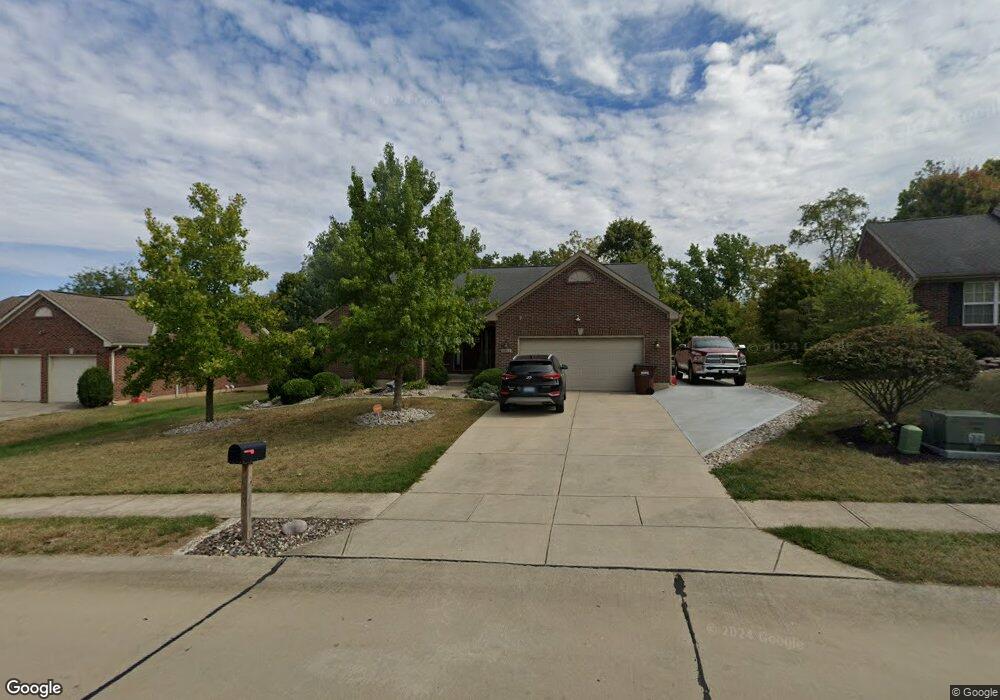
10613 Williamswoods Dr Independence, KY 41051
Estimated Value: $385,000 - $411,000
3
Beds
3
Baths
1,756
Sq Ft
$227/Sq Ft
Est. Value
About This Home
This home is located at 10613 Williamswoods Dr, Independence, KY 41051 and is currently estimated at $398,158, approximately $226 per square foot. 10613 Williamswoods Dr is a home located in Kenton County with nearby schools including Kenton Elementary School, Twenhofel Middle School, and Simon Kenton High School.
Ownership History
Date
Name
Owned For
Owner Type
Purchase Details
Closed on
Dec 29, 2017
Sold by
Raymer Mark E and Raymer Vickie L
Bought by
Hamilton Randel E
Current Estimated Value
Home Financials for this Owner
Home Financials are based on the most recent Mortgage that was taken out on this home.
Original Mortgage
$232,750
Outstanding Balance
$196,464
Interest Rate
3.95%
Mortgage Type
New Conventional
Estimated Equity
$201,694
Purchase Details
Closed on
Jan 3, 2006
Sold by
Arlinghaus Builders Llc
Bought by
Raymer Mark E and Raymer Vickie L
Home Financials for this Owner
Home Financials are based on the most recent Mortgage that was taken out on this home.
Original Mortgage
$115,000
Interest Rate
6.14%
Mortgage Type
Fannie Mae Freddie Mac
Purchase Details
Closed on
Feb 24, 2005
Sold by
Arlinghaus I Llc
Bought by
Arlinghaus Builders Llc
Create a Home Valuation Report for This Property
The Home Valuation Report is an in-depth analysis detailing your home's value as well as a comparison with similar homes in the area
Home Values in the Area
Average Home Value in this Area
Purchase History
| Date | Buyer | Sale Price | Title Company |
|---|---|---|---|
| Hamilton Randel E | $245,000 | Agility Closing And Title Se | |
| Raymer Mark E | $216,756 | None Available | |
| Arlinghaus Builders Llc | -- | -- |
Source: Public Records
Mortgage History
| Date | Status | Borrower | Loan Amount |
|---|---|---|---|
| Open | Hamilton Randel E | $232,750 | |
| Previous Owner | Raymer Mark E | $115,000 |
Source: Public Records
Tax History Compared to Growth
Tax History
| Year | Tax Paid | Tax Assessment Tax Assessment Total Assessment is a certain percentage of the fair market value that is determined by local assessors to be the total taxable value of land and additions on the property. | Land | Improvement |
|---|---|---|---|---|
| 2024 | $3,440 | $280,800 | $40,000 | $240,800 |
| 2023 | $3,544 | $280,800 | $40,000 | $240,800 |
| 2022 | $3,597 | $280,800 | $40,000 | $240,800 |
| 2021 | $3,651 | $280,800 | $40,000 | $240,800 |
| 2020 | $3,263 | $245,000 | $40,000 | $205,000 |
| 2019 | $3,271 | $245,000 | $40,000 | $205,000 |
| 2018 | $3,289 | $245,000 | $40,000 | $205,000 |
| 2017 | $2,838 | $216,700 | $40,000 | $176,700 |
| 2015 | $2,759 | $216,700 | $30,000 | $186,700 |
| 2014 | $2,720 | $216,700 | $30,000 | $186,700 |
Source: Public Records
Map
Nearby Homes
- 1095 Audas Ct
- 1119 Brigade Rd
- 1805 Autumn Maple Dr
- The Lancaster Plan at Williams Woods
- The Courtney Plan at Williams Woods
- The Ella Marie Plan at Williams Woods
- The Marietta Plan at Williams Woods
- The Verona Plan at Williams Woods
- The Avalon Plan at Williams Woods
- The Camden Plan at Williams Woods
- The Mariemont Plan at Williams Woods
- The Livingston Plan at Williams Woods
- The Westchester Plan at Williams Woods
- The Kendall Plan at Williams Woods
- The Waterson Plan at Williams Woods
- The Lincoln Plan at Williams Woods
- The Austin Plan at Williams Woods
- The Leighann Plan at Williams Woods
- The Jefferson Plan at Williams Woods
- The Madison Plan at Williams Woods
- 10609 Williamswoods Dr Unit 58WW
- 10617 Williamswoods Dr
- 10605 Williamswoods Dr Unit 57WW
- 10621 Williamswoods Dr
- 10614 Williamswoods Dr
- 10614 Williamswoods Dr Unit 68WW
- 10618 Williamswoods Dr
- 10618 Williamswoods Dr Unit 69WW
- 10610 Williamswoods Dr
- 10610 Williamswoods Dr Unit 67WW
- 10601 Williamswoods Dr
- 10625 Williamswoods Dr
- 10622 Williamswoods Dr
- 36 Williamswoods Dr
- 57 Williamswoods Dr
- 33 Williamswoods Dr
- 32 Williamswoods Dr
- 34 Williamswoods Dr
- 39 Williams Woods Dr
- 23 Williamswoods Dr