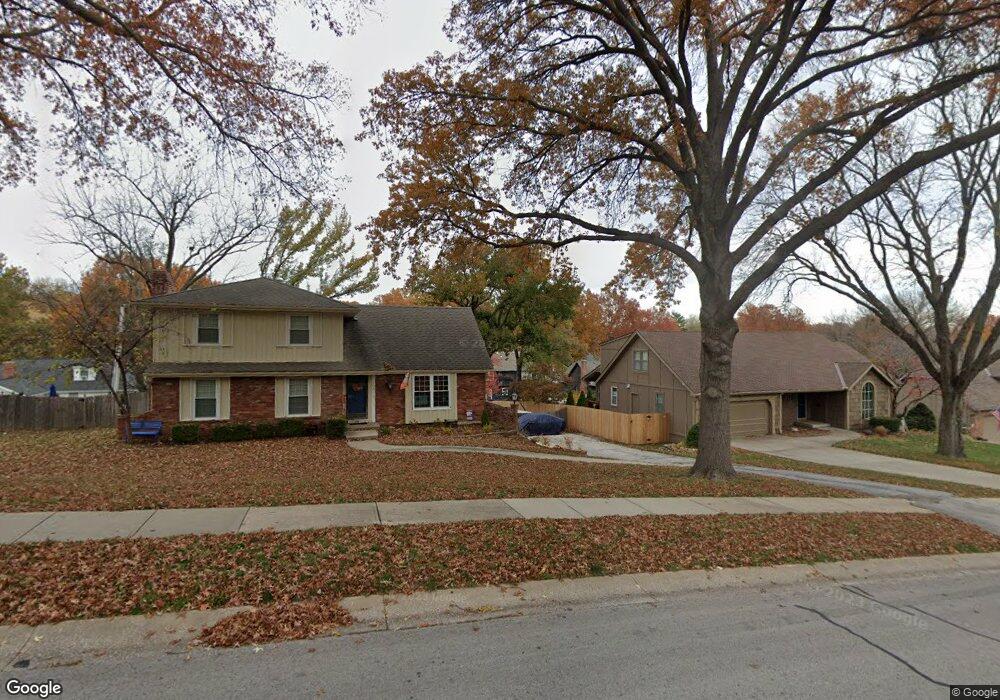
10618 W 52nd Cir Shawnee, KS 66203
Estimated Value: $416,000 - $448,000
5
Beds
4
Baths
2,172
Sq Ft
$196/Sq Ft
Est. Value
About This Home
This home is located at 10618 W 52nd Cir, Shawnee, KS 66203 and is currently estimated at $425,976, approximately $196 per square foot. 10618 W 52nd Cir is a home located in Johnson County with nearby schools including Bluejacket / Flint Elementary, Hocker Grove Middle School, and Shawnee Mission North High School.
Ownership History
Date
Name
Owned For
Owner Type
Purchase Details
Closed on
Jul 20, 2009
Sold by
Federal National Mortgage Association
Bought by
Anderson Arnold T and Johnson Heather N
Current Estimated Value
Home Financials for this Owner
Home Financials are based on the most recent Mortgage that was taken out on this home.
Original Mortgage
$167,887
Outstanding Balance
$111,779
Interest Rate
5.71%
Mortgage Type
FHA
Estimated Equity
$314,197
Purchase Details
Closed on
Jan 8, 2008
Sold by
Hoefler Charles R and National City Mortgage Co
Bought by
Federal National Mortgage Association
Purchase Details
Closed on
Jul 7, 2005
Sold by
Williams Mark J and Williams Barbara J
Bought by
Hoefler Charles R and Hoefler Wendy L
Home Financials for this Owner
Home Financials are based on the most recent Mortgage that was taken out on this home.
Original Mortgage
$41,200
Interest Rate
5.22%
Mortgage Type
Stand Alone Second
Create a Home Valuation Report for This Property
The Home Valuation Report is an in-depth analysis detailing your home's value as well as a comparison with similar homes in the area
Home Values in the Area
Average Home Value in this Area
Purchase History
| Date | Buyer | Sale Price | Title Company |
|---|---|---|---|
| Anderson Arnold T | -- | Stewart Title Of Kansas City | |
| Federal National Mortgage Association | $178,050 | None Available | |
| Hoefler Charles R | -- | Chicago Title Insurance Co |
Source: Public Records
Mortgage History
| Date | Status | Borrower | Loan Amount |
|---|---|---|---|
| Open | Anderson Arnold T | $167,887 | |
| Previous Owner | Hoefler Charles R | $41,200 | |
| Previous Owner | Hoefler Charles R | $164,800 |
Source: Public Records
Tax History Compared to Growth
Tax History
| Year | Tax Paid | Tax Assessment Tax Assessment Total Assessment is a certain percentage of the fair market value that is determined by local assessors to be the total taxable value of land and additions on the property. | Land | Improvement |
|---|---|---|---|---|
| 2024 | $5,620 | $38,847 | $7,453 | $31,394 |
| 2023 | $6,214 | $40,342 | $8,145 | $32,197 |
| 2022 | $6,289 | $35,696 | $7,405 | $28,291 |
| 2021 | $3,786 | $33,028 | $6,437 | $26,591 |
| 2020 | $4,774 | $32,315 | $5,848 | $26,467 |
| 2019 | $4,411 | $29,290 | $4,647 | $24,643 |
| 2018 | $5,006 | $27,508 | $4,647 | $22,861 |
| 2017 | $2,898 | $24,414 | $4,219 | $20,195 |
| 2016 | $5,098 | $21,988 | $4,219 | $17,769 |
| 2015 | $2,417 | $20,895 | $4,219 | $16,676 |
| 2013 | -- | $19,354 | $4,219 | $15,135 |
Source: Public Records
Map
Nearby Homes
- 10116 W 52nd Terrace
- 10511 W 49th Place
- Ashwood Plan at Bristol Highlands - North
- The Fleetwood Plan at Bristol Highlands - The Villas
- Cypress II Plan at Bristol Highlands - North
- The Fleetwood Plan at Bristol Highlands - The Manors
- The Brentwood Plan at Bristol Highlands - The Villas
- Yorkshire V Plan at Bristol Highlands - North
- The Kirkwood Plan at Bristol Highlands - The Villas
- 8013 Payne St
- The Rockwood Plan at Bristol Highlands - The Villas
- Magnolia Plan at Bristol Highlands - North
- 9929 W 52nd St
- 5308 Mcanany Dr
- 11002 W 55th Terrace
- 0 W 49th St
- 11403 W 51st Terrace
- 9719 W 53rd St
- 5003 Knox Ave
- 5220 Hayes St
- 10612 W 52nd Cir
- 10622 W 52nd Cir
- 5131 Ballentine St
- 5127 Ballentine St
- 10606 W 52nd Cir
- 5133 Ballentine St
- 5123 Ballentine St
- 10623 W 52nd Cir
- 10615 W 52nd Cir
- 10619 W 52nd Cir
- 10627 W 52nd Cir
- 10600 W 52nd Cir
- 5119 Ballentine St
- 10700 W 52nd Cir
- 5126 Ballentine St
- 10513 W 52nd St
- 5122 Ballentine St
- 5136 Ballentine St
- 5130 Ballentine St
- 10631 W 52nd Cir