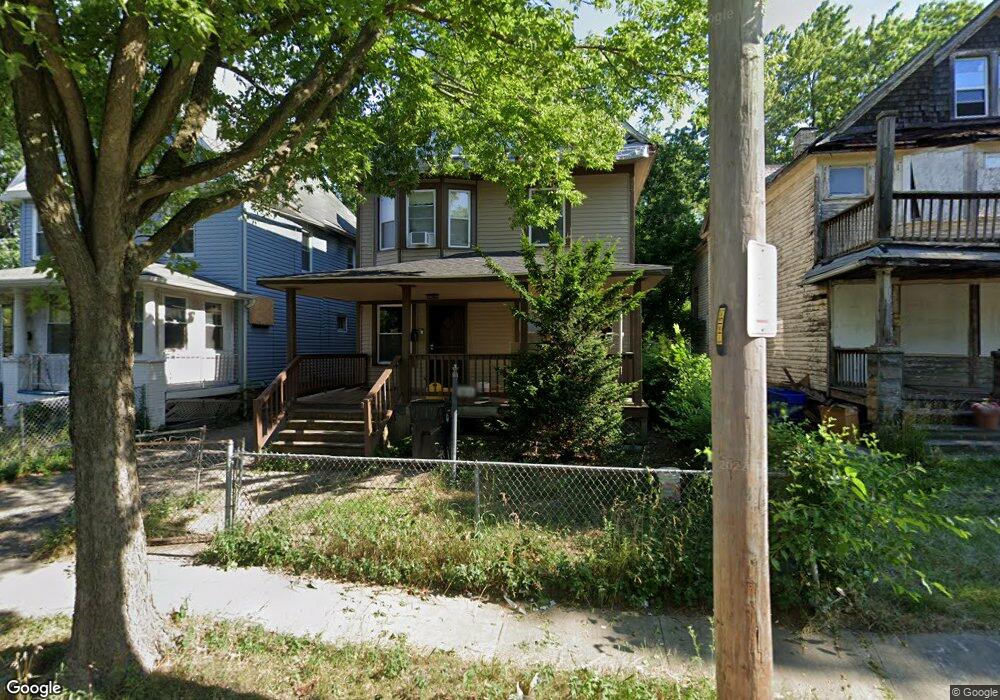
10619 Gooding Ave Cleveland, OH 44108
Glenville NeighborhoodEstimated Value: $67,833 - $118,000
4
Beds
3
Baths
1,603
Sq Ft
$58/Sq Ft
Est. Value
About This Home
This home is located at 10619 Gooding Ave, Cleveland, OH 44108 and is currently estimated at $93,208, approximately $58 per square foot. 10619 Gooding Ave is a home located in Cuyahoga County with nearby schools including Bolton, Anton Grdina School, and Andrew J. Rickoff School.
Ownership History
Date
Name
Owned For
Owner Type
Purchase Details
Closed on
Aug 16, 2022
Sold by
William Aiello
Bought by
Democlean Salvation Inc
Current Estimated Value
Purchase Details
Closed on
Jul 28, 2021
Sold by
Democlean Salvation Inc
Bought by
Aeillo William
Purchase Details
Closed on
May 11, 2021
Sold by
Koroman Nevio
Bought by
Democlean Salvation Inc
Purchase Details
Closed on
Mar 11, 2021
Sold by
Technobeacon Ohio Partners Llp
Bought by
Koroman Nevio
Purchase Details
Closed on
Apr 3, 2017
Sold by
Keaton Investments Llc
Bought by
Technobeacon Ohio Partners Llp
Purchase Details
Closed on
Jul 14, 2016
Sold by
Mccollins Derrick
Bought by
Keaton Investments Llc
Purchase Details
Closed on
Mar 22, 2012
Sold by
Hedge Carol
Bought by
Mccollins Derrick
Purchase Details
Closed on
May 13, 2009
Sold by
Jackson Emma Jean
Bought by
Jackson Emma Jean and Hedge Carol
Purchase Details
Closed on
Jan 1, 1975
Bought by
Jackson Emma J and Jackson George F
Create a Home Valuation Report for This Property
The Home Valuation Report is an in-depth analysis detailing your home's value as well as a comparison with similar homes in the area
Home Values in the Area
Average Home Value in this Area
Purchase History
| Date | Buyer | Sale Price | Title Company |
|---|---|---|---|
| Democlean Salvation Inc | -- | None Listed On Document | |
| Aeillo William | -- | Fairmount Title | |
| Democlean Salvation Inc | $13,000 | Fairmount Title | |
| Koroman Nevio | $4,800 | None Available | |
| Technobeacon Ohio Partners Llp | $4,100 | None Available | |
| Keaton Investments Llc | $5,371 | Attorney | |
| Mccollins Derrick | $4,500 | Northstar Title Agency | |
| Jackson Emma Jean | -- | None Available | |
| Jackson Emma J | -- | -- |
Source: Public Records
Tax History Compared to Growth
Tax History
| Year | Tax Paid | Tax Assessment Tax Assessment Total Assessment is a certain percentage of the fair market value that is determined by local assessors to be the total taxable value of land and additions on the property. | Land | Improvement |
|---|---|---|---|---|
| 2024 | $438 | $6,545 | $2,835 | $3,710 |
| 2023 | $307 | $3,960 | $1,580 | $2,380 |
| 2022 | $299 | $3,955 | $1,575 | $2,380 |
| 2021 | $578 | $3,960 | $1,580 | $2,380 |
| 2020 | $576 | $3,260 | $1,300 | $1,960 |
| 2019 | $716 | $9,300 | $3,700 | $5,600 |
| 2018 | $193 | $3,260 | $1,300 | $1,960 |
| 2017 | $122 | $1,440 | $810 | $630 |
| 2016 | $3,400 | $1,440 | $810 | $630 |
| 2015 | $1,352 | $1,440 | $810 | $630 |
| 2014 | $1,088 | $1,580 | $880 | $700 |
Source: Public Records
Map
Nearby Homes
- 10525 Gooding Ave
- 10713 Gooding Ave
- 10515 Greenlawn Ave
- 10413 Yale Ave
- 10328 Empire Ave
- 10321 Kempton Ave
- 994 Parkwood Dr
- 10721 Englewood Ave
- 10313 Pierpont Ave
- 786 Parkwood Dr
- 11109 Greenview Ave
- 769 E 103rd St
- 10100 Yale Ave
- 10703 Kimberley Ave
- 10009 Parmelee Ave
- 10003 Empire Ave
- 11212 Greenview Ave
- 9902 Garfield Ave
- 9901 Columbia Ave
- 735 Parkwood Dr
- 10615 Gooding Ave
- 10623 Gooding Ave
- 10611 Gooding Ave
- 10625 Gooding Ave
- 10607 Gooding Ave
- 10627 Gooding Ave
- 10620 Earle Ave
- 10616 Earle Ave
- 10610 Earle Ave
- 10631 Gooding Ave
- 10614 Gooding Ave
- 10616 Gooding Ave
- 10622 Gooding Ave
- 10624 Gooding Ave
- 10626 Gooding Ave
- 10606 Earle Ave
- 10632 Earle Ave
- 10610 Gooding Ave
- 10701 Gooding Ave
- 10602 Earle Ave Unit UP