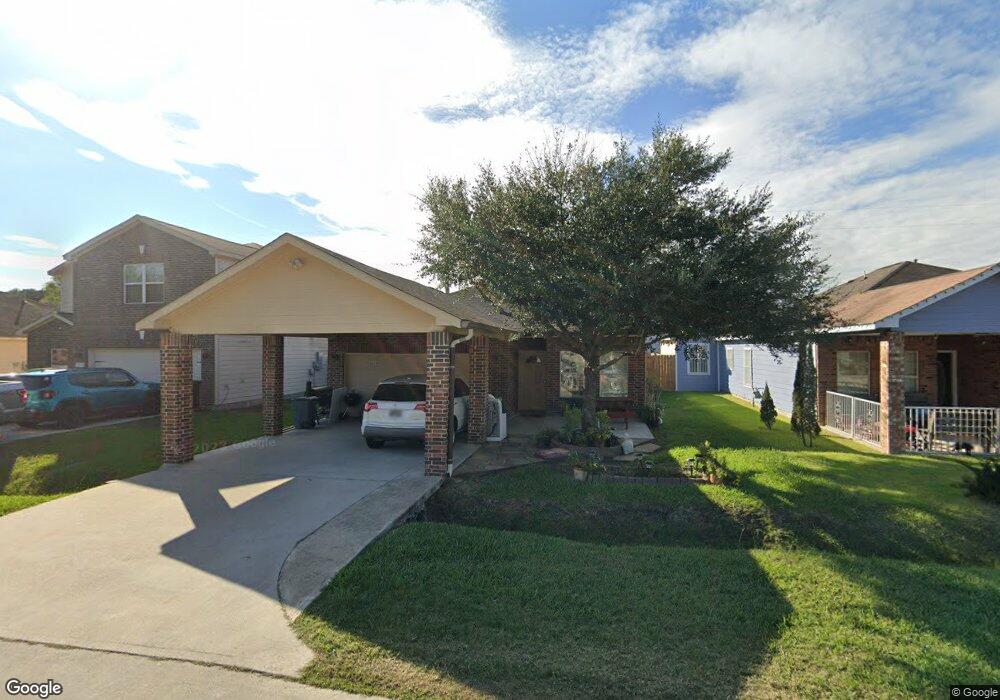
10619 Logger Pine Trail Houston, TX 77088
North Houston NeighborhoodEstimated Value: $209,489 - $239,000
3
Beds
2
Baths
1,345
Sq Ft
$168/Sq Ft
Est. Value
About This Home
This home is located at 10619 Logger Pine Trail, Houston, TX 77088 and is currently estimated at $226,622, approximately $168 per square foot. 10619 Logger Pine Trail is a home located in Harris County with nearby schools including Stovall School, Caraway Intermediate School, and Caraway Elementary School.
Ownership History
Date
Name
Owned For
Owner Type
Purchase Details
Closed on
Dec 28, 2012
Sold by
Hernandez Mario A
Bought by
Arreola Sanchez Juan M
Current Estimated Value
Purchase Details
Closed on
Apr 17, 2012
Sold by
Jackson John D and Jackson Donna Cook
Bought by
Eberey James P
Purchase Details
Closed on
Mar 24, 2009
Sold by
Sweeton Buell
Bought by
Jackson John D and Jackson Donna Cook
Home Financials for this Owner
Home Financials are based on the most recent Mortgage that was taken out on this home.
Original Mortgage
$112,500
Interest Rate
5.24%
Mortgage Type
Purchase Money Mortgage
Purchase Details
Closed on
Nov 30, 2007
Sold by
Pine Valley Development Corp
Bought by
Sweeton Buell
Home Financials for this Owner
Home Financials are based on the most recent Mortgage that was taken out on this home.
Original Mortgage
$98,496
Interest Rate
6.43%
Mortgage Type
Construction
Create a Home Valuation Report for This Property
The Home Valuation Report is an in-depth analysis detailing your home's value as well as a comparison with similar homes in the area
Home Values in the Area
Average Home Value in this Area
Purchase History
| Date | Buyer | Sale Price | Title Company |
|---|---|---|---|
| Arreola Sanchez Juan M | -- | Old Republic National Title | |
| Eberey James P | -- | None Available | |
| Jackson John D | -- | Vanguard Title | |
| Sweeton Buell | -- | Houston Title Co |
Source: Public Records
Mortgage History
| Date | Status | Borrower | Loan Amount |
|---|---|---|---|
| Previous Owner | Jackson John D | $112,500 | |
| Previous Owner | Sweeton Buell | $98,496 |
Source: Public Records
Tax History Compared to Growth
Tax History
| Year | Tax Paid | Tax Assessment Tax Assessment Total Assessment is a certain percentage of the fair market value that is determined by local assessors to be the total taxable value of land and additions on the property. | Land | Improvement |
|---|---|---|---|---|
| 2025 | $5,615 | $194,581 | $41,081 | $153,500 |
| 2024 | $5,615 | $184,731 | $41,081 | $143,650 |
| 2023 | $5,615 | $196,033 | $41,081 | $154,952 |
| 2022 | $5,617 | $168,885 | $28,735 | $140,150 |
| 2021 | $4,835 | $139,918 | $28,735 | $111,183 |
| 2020 | $4,764 | $133,373 | $28,735 | $104,638 |
| 2019 | $5,445 | $148,012 | $28,735 | $119,277 |
| 2018 | $1,909 | $132,945 | $28,735 | $104,210 |
| 2017 | $3,476 | $97,468 | $12,771 | $84,697 |
| 2016 | $3,476 | $97,468 | $12,771 | $84,697 |
| 2015 | $3,269 | $92,619 | $12,771 | $79,848 |
| 2014 | $3,269 | $92,619 | $12,771 | $79,848 |
Source: Public Records
Map
Nearby Homes
- 10555 Logger Pine Trail
- 10527 Logger Pine Trail
- 10634 Logger Pine Trail
- 10642 Logger Pine Trail Unit B
- 10506 Pine Landing Dr
- 2415 Fallen Pine Ln
- 2418 Fallen Pine Ln
- 2422 Fallen Pine Ln
- 2234 Hampton St
- 1918 Hampton St
- 2020 & 2022 Wavell St
- 2026 Wavell St
- 2326 Wavell St
- 2325 Hampton St
- 2323 Hampton St
- 2200 Hampton St
- 2330 Wavell St
- 2106 Dewalt St Unit A
- 9298 Plan at Shiloh Reserve
- 9297 Plan at Shiloh Reserve
- 10619 Logger Pine Trails
- 10615 Logger Pine Trail
- 10623 Logger Pine Trails
- 10622 Pine Landing Dr
- 10622 Pine Landing Dr Unit A
- 10618 Pine Landing Dr
- 10618 Pine Landing Dr Unit B
- 10627 Logger Pine Trail
- 10611 Logger Pine Trails
- 10614 Pine Landing Dr
- 10626 Pine Landing Dr
- 10626 Pine Landing Dr Unit B
- 10610 Pine Landing Dr
- 10610 Pine Landing Dr Unit B
- 10618 Logger Pine Trails
- 10618 Logger Pine Trail
- 10607 Logger Pine Trails
- 10607 Logger Pine Trail
- 10631 Logger Pine Trail
- 10622 Logger Pine Trails