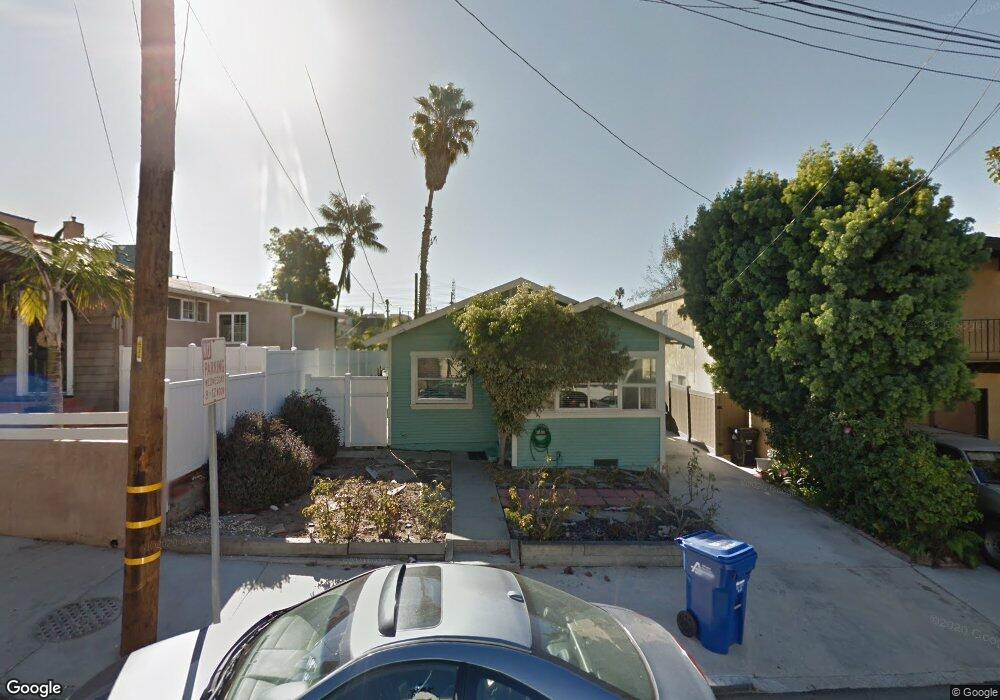
1062 3rd St Hermosa Beach, CA 90254
Estimated Value: $1,675,000 - $2,205,000
3
Beds
1
Bath
1,809
Sq Ft
$1,099/Sq Ft
Est. Value
About This Home
This home is located at 1062 3rd St, Hermosa Beach, CA 90254 and is currently estimated at $1,987,446, approximately $1,098 per square foot. 1062 3rd St is a home located in Los Angeles County with nearby schools including Hermosa View Elementary School, Hermosa Valley Elementary School, and Our Lady of Guadalupe School.
Ownership History
Date
Name
Owned For
Owner Type
Purchase Details
Closed on
Mar 2, 2005
Sold by
Spann Paul
Bought by
Schelly Thomas H and Schelly Mary A
Current Estimated Value
Home Financials for this Owner
Home Financials are based on the most recent Mortgage that was taken out on this home.
Original Mortgage
$612,000
Outstanding Balance
$313,141
Interest Rate
5.75%
Mortgage Type
Stand Alone First
Estimated Equity
$1,674,305
Purchase Details
Closed on
Sep 18, 2002
Sold by
Spann Paul
Bought by
Spann Paul and Clarke Eileen S
Purchase Details
Closed on
Dec 3, 1999
Sold by
Dorsey Martin C
Bought by
Spann Paul
Home Financials for this Owner
Home Financials are based on the most recent Mortgage that was taken out on this home.
Original Mortgage
$255,200
Interest Rate
8.5%
Create a Home Valuation Report for This Property
The Home Valuation Report is an in-depth analysis detailing your home's value as well as a comparison with similar homes in the area
Home Values in the Area
Average Home Value in this Area
Purchase History
| Date | Buyer | Sale Price | Title Company |
|---|---|---|---|
| Schelly Thomas H | $765,000 | Chicago Title Co | |
| Spann Paul | -- | -- | |
| Spann Paul | $319,000 | South Coast Title Company |
Source: Public Records
Mortgage History
| Date | Status | Borrower | Loan Amount |
|---|---|---|---|
| Open | Schelly Thomas H | $612,000 | |
| Previous Owner | Spann Paul | $255,200 | |
| Closed | Spann Paul | $63,800 | |
| Closed | Schelly Thomas H | $153,000 |
Source: Public Records
Tax History
| Year | Tax Paid | Tax Assessment Tax Assessment Total Assessment is a certain percentage of the fair market value that is determined by local assessors to be the total taxable value of land and additions on the property. | Land | Improvement |
|---|---|---|---|---|
| 2025 | $14,492 | $1,354,907 | $853,070 | $501,837 |
| 2024 | $14,492 | $1,328,342 | $836,344 | $491,998 |
| 2023 | $14,195 | $1,302,297 | $819,946 | $482,351 |
| 2022 | $13,940 | $1,276,763 | $803,869 | $472,894 |
| 2021 | $13,656 | $985,129 | $788,107 | $197,022 |
| 2019 | $10,542 | $955,911 | $764,732 | $191,179 |
| 2018 | $10,174 | $937,169 | $749,738 | $187,431 |
| 2016 | $9,680 | $900,779 | $720,626 | $180,153 |
| 2015 | $9,494 | $887,249 | $709,802 | $177,447 |
| 2014 | $8,135 | $767,000 | $613,600 | $153,400 |
Source: Public Records
Map
Nearby Homes
- 1001 2nd St
- 959 5th St Unit A
- 1206 1st Place
- 707 2nd St
- 1600 Spreckels Ln
- 719 1st Place
- 647 2nd St
- 654 5th St
- 168 Ardmore Ave
- 622 1st Place
- 1637 Armour Ln
- 501 Herondo St Unit 18
- 501 Herondo St Unit 50
- 1730 Van Horne Ln
- 1723 Havemeyer Ln
- 909 Montgomery Dr
- 710 11th St Unit 3
- 867 Aubrey Ct Unit 2
- 867 Aubrey Ct Unit 3
- 867 Aubrey Ct Unit 1
Your Personal Tour Guide
Ask me questions while you tour the home.