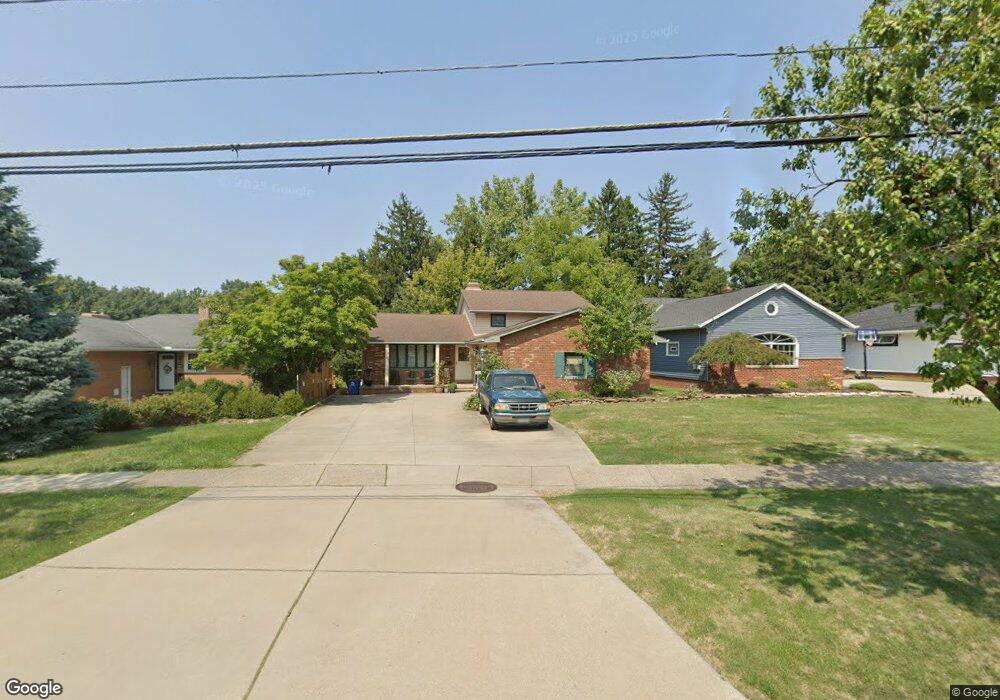
10620 Biddulph Rd Cleveland, OH 44144
Estimated Value: $273,000 - $309,000
3
Beds
2
Baths
2,288
Sq Ft
$126/Sq Ft
Est. Value
About This Home
This home is located at 10620 Biddulph Rd, Cleveland, OH 44144 and is currently estimated at $288,723, approximately $126 per square foot. 10620 Biddulph Rd is a home located in Cuyahoga County with nearby schools including Brooklyn Elementary School, Brooklyn High School, and Heritage Christian School.
Ownership History
Date
Name
Owned For
Owner Type
Purchase Details
Closed on
Aug 24, 2006
Sold by
The Cit Group/Consumer Finance Inc
Bought by
Beavers Marvin D
Current Estimated Value
Home Financials for this Owner
Home Financials are based on the most recent Mortgage that was taken out on this home.
Original Mortgage
$26,820
Outstanding Balance
$16,039
Interest Rate
6.5%
Mortgage Type
Stand Alone Second
Estimated Equity
$272,684
Purchase Details
Closed on
Apr 27, 2006
Sold by
Jackiewicz Gary L and Jackiewicz Susan M
Bought by
The Cit Group/Consumer Finance Inc
Purchase Details
Closed on
Sep 30, 1993
Sold by
Pasak Eric W
Bought by
Jackiewicz Susan M
Purchase Details
Closed on
May 24, 1977
Sold by
Crisafi Betty J
Bought by
Pasak Eric W
Purchase Details
Closed on
Jan 1, 1975
Bought by
Crisafi Betty J
Create a Home Valuation Report for This Property
The Home Valuation Report is an in-depth analysis detailing your home's value as well as a comparison with similar homes in the area
Home Values in the Area
Average Home Value in this Area
Purchase History
| Date | Buyer | Sale Price | Title Company |
|---|---|---|---|
| Beavers Marvin D | $178,800 | Title First Agency | |
| The Cit Group/Consumer Finance Inc | -- | None Available | |
| Jackiewicz Susan M | $138,500 | -- | |
| Pasak Eric W | $85,000 | -- | |
| Crisafi Betty J | -- | -- |
Source: Public Records
Mortgage History
| Date | Status | Borrower | Loan Amount |
|---|---|---|---|
| Open | Beavers Marvin D | $26,820 | |
| Open | Beavers Marvin D | $143,000 |
Source: Public Records
Tax History Compared to Growth
Tax History
| Year | Tax Paid | Tax Assessment Tax Assessment Total Assessment is a certain percentage of the fair market value that is determined by local assessors to be the total taxable value of land and additions on the property. | Land | Improvement |
|---|---|---|---|---|
| 2024 | $5,799 | $83,965 | $14,315 | $69,650 |
| 2023 | $5,223 | $70,180 | $15,160 | $55,020 |
| 2022 | $5,178 | $70,180 | $15,160 | $55,020 |
| 2021 | $5,268 | $70,180 | $15,160 | $55,020 |
| 2020 | $4,923 | $59,990 | $12,950 | $47,040 |
| 2019 | $4,831 | $171,400 | $37,000 | $134,400 |
| 2018 | $4,435 | $59,990 | $12,950 | $47,040 |
| 2017 | $4,198 | $53,240 | $10,990 | $42,250 |
| 2016 | $4,191 | $53,240 | $10,990 | $42,250 |
| 2015 | $4,090 | $53,240 | $10,990 | $42,250 |
| 2014 | $4,090 | $52,190 | $10,780 | $41,410 |
Source: Public Records
Map
Nearby Homes
- 9912 Richard Dr
- 4728 Summer Ln
- 9909 Richard Dr
- 9416 Behrwald Ave
- 10401 Manoa Ave
- 11729 Erwin Ave
- 4830 Autumn Ln
- 9756 Memphis Villas Blvd
- 9416 Outlook Dr
- 9739 Memphis Villas Blvd
- 8906 Behrwald Ave
- 4574 Bentwood Dr
- 4722 Bentwood Dr
- 12009 Mcgowan Ave
- 12010 Longmead Ave
- 9005 Ansonia Ave
- 9304 Torrance Ave
- 12301 Carrington Ave
- 4444 Roadoan Rd
- 12518 Erwin Ave
- 10616 Biddulph Rd
- 10700 Biddulph Rd
- 10600 Biddulph Rd
- 10716 Biddulph Rd
- 10522 Biddulph Rd
- 10500 Biddulph Rd
- 10603 Biddulph Rd
- 10575 Biddulph Rd
- 10418 Biddulph Rd
- 10555 Biddulph Rd
- 10615 Biddulph Rd
- 10410 Biddulph Rd
- 10419 Biddulph Rd
- 10413 Biddulph Rd
- 10408 Biddulph Rd
- 10407 Biddulph Rd
- 10401 Biddulph Rd
- 10316 Biddulph Rd
- 4712 Fairway Dr
- 4716 Fairway Dr