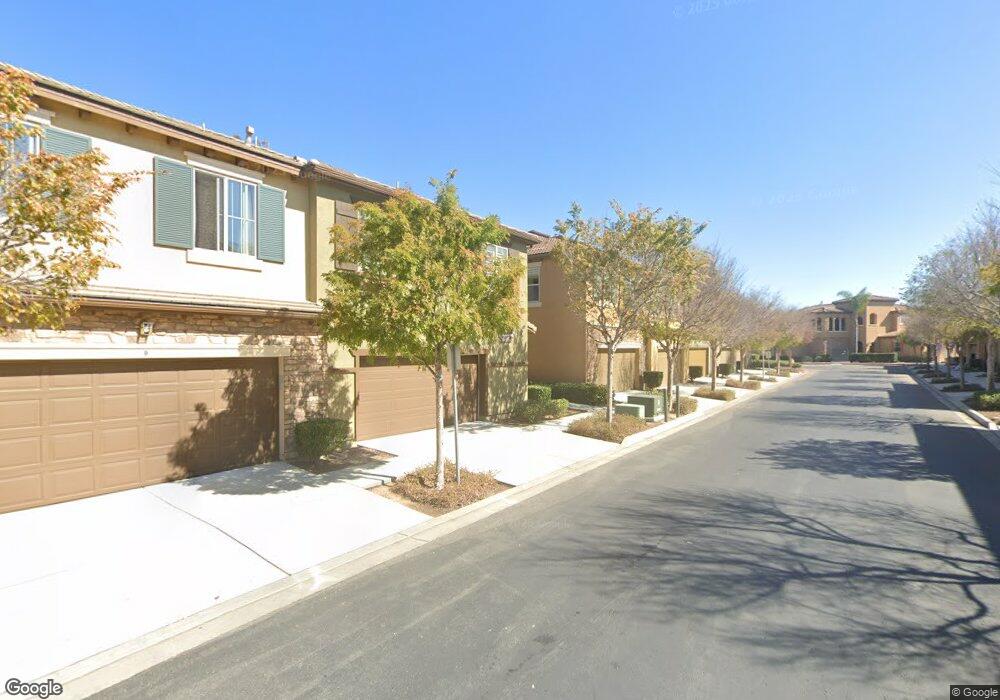
10620 Canyon Grove Unit 7 San Diego, CA 92130
Carmel Valley NeighborhoodEstimated Value: $1,247,000 - $1,334,000
3
Beds
3
Baths
1,636
Sq Ft
$780/Sq Ft
Est. Value
About This Home
This home is located at 10620 Canyon Grove Unit 7, San Diego, CA 92130 and is currently estimated at $1,276,366, approximately $780 per square foot. 10620 Canyon Grove Unit 7 is a home located in San Diego County with nearby schools including Sage Canyon School, Carmel Valley Middle School, and Torrey Pines High School.
Ownership History
Date
Name
Owned For
Owner Type
Purchase Details
Closed on
Aug 24, 2025
Sold by
Currah Andrew D and Currah Leila M
Bought by
Currah Family Trust and Currah
Current Estimated Value
Purchase Details
Closed on
Apr 21, 2015
Sold by
Kan Julie
Bought by
Currah Andrew D and Currah Leila M
Home Financials for this Owner
Home Financials are based on the most recent Mortgage that was taken out on this home.
Original Mortgage
$410,000
Interest Rate
3.63%
Mortgage Type
New Conventional
Purchase Details
Closed on
Oct 5, 2012
Sold by
Kan Julie and Kan Julie L C
Bought by
Kan Julie L C
Purchase Details
Closed on
Jul 28, 2010
Sold by
Pardee Homes
Bought by
Kan Julie
Home Financials for this Owner
Home Financials are based on the most recent Mortgage that was taken out on this home.
Original Mortgage
$300,000
Interest Rate
4.16%
Mortgage Type
New Conventional
Create a Home Valuation Report for This Property
The Home Valuation Report is an in-depth analysis detailing your home's value as well as a comparison with similar homes in the area
Home Values in the Area
Average Home Value in this Area
Purchase History
| Date | Buyer | Sale Price | Title Company |
|---|---|---|---|
| Currah Family Trust | -- | None Listed On Document | |
| Currah Andrew D | $690,000 | California Title Company | |
| Kan Julie L C | -- | None Available | |
| Kan Julie | $542,500 | First American Title Insuran |
Source: Public Records
Mortgage History
| Date | Status | Borrower | Loan Amount |
|---|---|---|---|
| Previous Owner | Currah Andrew D | $410,000 | |
| Previous Owner | Kan Julie | $300,000 |
Source: Public Records
Tax History Compared to Growth
Tax History
| Year | Tax Paid | Tax Assessment Tax Assessment Total Assessment is a certain percentage of the fair market value that is determined by local assessors to be the total taxable value of land and additions on the property. | Land | Improvement |
|---|---|---|---|---|
| 2025 | $9,466 | $829,266 | $497,241 | $332,025 |
| 2024 | $9,466 | $813,007 | $487,492 | $325,515 |
| 2023 | $9,385 | $797,067 | $477,934 | $319,133 |
| 2022 | $9,249 | $781,439 | $468,563 | $312,876 |
| 2021 | $8,941 | $766,118 | $459,376 | $306,742 |
| 2020 | $8,969 | $758,263 | $454,666 | $303,597 |
| 2019 | $8,809 | $743,396 | $445,751 | $297,645 |
| 2018 | $8,458 | $728,820 | $437,011 | $291,809 |
| 2017 | $8,314 | $714,531 | $428,443 | $286,088 |
| 2016 | $8,076 | $700,522 | $420,043 | $280,479 |
| 2015 | $6,796 | $577,788 | $346,450 | $231,338 |
| 2014 | -- | $566,471 | $339,664 | $226,807 |
Source: Public Records
Map
Nearby Homes
- 10794 Spur Point Ct
- 5398 Shannon Ridge Ln
- 10941 Derrydown Way Unit 10
- 5255 Greenwillow Ln
- 10553 Gaylemont Ln Unit 5
- 0 Grand Del Mar Place Unit VU 8-4-5 NDP2502279
- 5171 Del Mar Mesa Rd
- 6286 Belmont Trail Ct
- 6370 Carmel View S
- 5049 Ruette de Mer
- 5970 Shaw Lopez Row
- 11649 Thistle Hill Place
- 12722 Sandy Crest Ct
- 12436 Cavallo St
- 12518 Cavallo St
- 4289 Calle Isabelino
- 11325 Carmel Creek Rd
- 6718 Indio Way
- 3975 San Gregorio Way
- 11265 Caminito Aclara
- 10620 Canyon Grove Unit 8
- 10620 Canyon Grove Unit 10
- 10620 Canyon Grove Unit 10
- 10620 Canyon Grove Unit 9
- 10620 Canyon Grove Unit 7
- 10620 Canyon Grove Unit 6
- 10611 Canyon Grove Unit 1
- 10631 Canyon Grove
- 10631 Canyon Grove Unit 11
- 10631 Canyon Grove Trail Unit 14
- 10631 Canyon Grove Unit 13
- 10631 Canyon Grove Unit 14
- 10650 Canyon Grove
- 10650 Canyon Grove Unit 16
- 10680 Canyon Grove Trail Unit 29
- 10650 Canyon Grove Trail
- 10650 Canyon Grove Trail Unit 18
- 10850 Cloverhurst Way
- 10680 Canyon Grove Unit 27
- 10661 Canyon Grove Unit 26