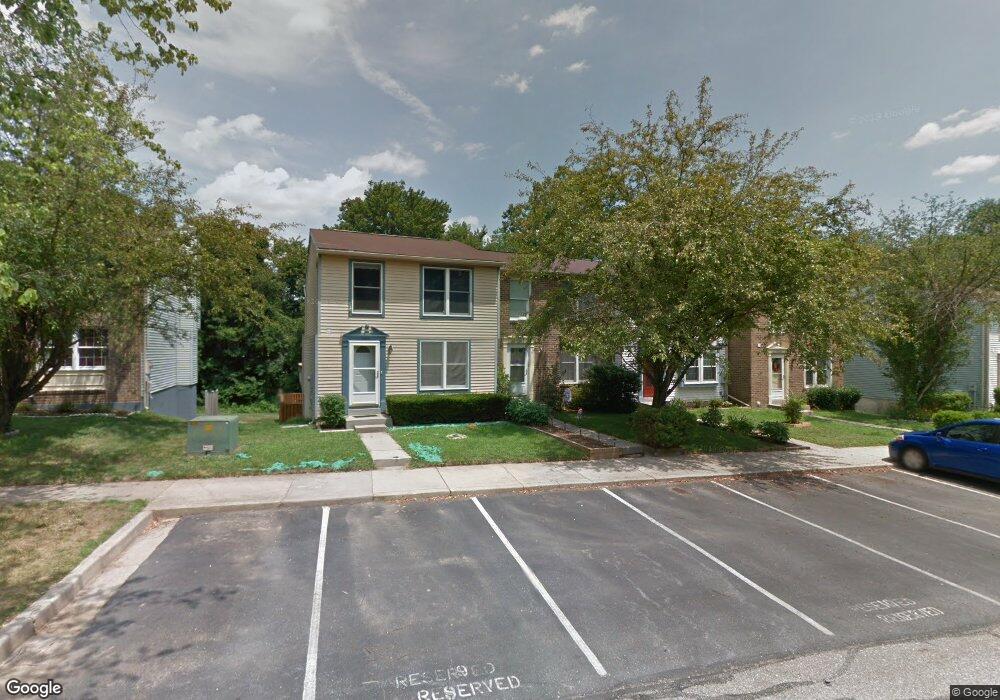
10623 Whiterock Ct Laurel, MD 20723
Estimated Value: $369,959 - $436,000
Studio
4
Baths
1,220
Sq Ft
$329/Sq Ft
Est. Value
About This Home
This home is located at 10623 Whiterock Ct, Laurel, MD 20723 and is currently estimated at $401,490, approximately $329 per square foot. 10623 Whiterock Ct is a home located in Howard County with nearby schools including Hammond Elementary School, Hammond Middle School, and Atholton High School.
Ownership History
Date
Name
Owned For
Owner Type
Purchase Details
Closed on
May 18, 2005
Sold by
Allen Thomas B
Bought by
Allen Thomas B and Allen Karen E
Current Estimated Value
Home Financials for this Owner
Home Financials are based on the most recent Mortgage that was taken out on this home.
Original Mortgage
$140,300
Outstanding Balance
$68,546
Interest Rate
4.87%
Mortgage Type
Adjustable Rate Mortgage/ARM
Estimated Equity
$332,944
Purchase Details
Closed on
May 16, 2005
Sold by
Allen Thomas B
Bought by
Allen Thomas B and Allen Karen E E
Home Financials for this Owner
Home Financials are based on the most recent Mortgage that was taken out on this home.
Original Mortgage
$140,300
Outstanding Balance
$68,546
Interest Rate
4.87%
Mortgage Type
Adjustable Rate Mortgage/ARM
Estimated Equity
$332,944
Purchase Details
Closed on
Sep 6, 2000
Sold by
Allen Thomas B
Bought by
Allen Thomas B and Hancock Karen E
Purchase Details
Closed on
Mar 8, 1999
Sold by
Allen Thomas B
Bought by
Allen Thomas B
Create a Home Valuation Report for This Property
The Home Valuation Report is an in-depth analysis detailing your home's value as well as a comparison with similar homes in the area
Home Values in the Area
Average Home Value in this Area
Purchase History
| Date | Buyer | Sale Price | Title Company |
|---|---|---|---|
| Allen Thomas B | -- | -- | |
| Allen Thomas B | -- | -- | |
| Allen Thomas B | -- | -- | |
| Allen Thomas B | -- | -- |
Source: Public Records
Mortgage History
| Date | Status | Borrower | Loan Amount |
|---|---|---|---|
| Open | Allen Thomas B | $140,300 |
Source: Public Records
Tax History
| Year | Tax Paid | Tax Assessment Tax Assessment Total Assessment is a certain percentage of the fair market value that is determined by local assessors to be the total taxable value of land and additions on the property. | Land | Improvement |
|---|---|---|---|---|
| 2025 | $4,880 | $335,200 | $155,000 | $180,200 |
| 2024 | $4,880 | $316,767 | $0 | $0 |
| 2023 | $4,612 | $298,333 | $0 | $0 |
| 2022 | $4,362 | $279,900 | $130,000 | $149,900 |
| 2021 | $4,236 | $275,533 | $0 | $0 |
| 2020 | $4,236 | $271,167 | $0 | $0 |
| 2019 | $4,174 | $266,800 | $80,000 | $186,800 |
| 2018 | $3,855 | $265,467 | $0 | $0 |
| 2017 | $3,692 | $266,800 | $0 | $0 |
| 2016 | -- | $262,800 | $0 | $0 |
| 2015 | -- | $254,667 | $0 | $0 |
| 2014 | -- | $246,533 | $0 | $0 |
Source: Public Records
Map
Nearby Homes
- 10747 Glen Hannah Dr
- 8251 Mary Lee Ln
- 10571 Scaggsville Rd
- 8002 Quail Rise Ln
- 7926 Helmart Dr
- 7920 Helmart Dr
- 8616 Doves Fly Way
- 10681 Old Bond Mill Rd
- 10725 E Crestview Ln
- 10213 Deep Skies Dr
- 8302 Spring Blossom Ct
- 9843 Snow Bird Ln
- 8380 Ice Crystal Dr
- 9046 Gorman Rd
- 9843 Wilderness Ln
- 9756 Knowledge Dr
- 9926 Cypress Way
- 7803 Tuckahoe Ct
- 7524 Sweet Hours Way Unit B
- 7507 Weather Worn Way Unit C
- 10625 Whiterock Ct
- 10621 Whiterock Ct
- 10627 Whiterock Ct
- 10617 Whiterock Ct
- 10631 Whiterock Ct
- 10615 Whiterock Ct
- 10613 Whiterock Ct
- 10633 Whiterock Ct
- 10635 Whiterock Ct
- 10611 Whiterock Ct
- 10637 Whiterock Ct
- 10577 Glen Hannah Dr
- 10575 Glen Hannah Dr
- 10607 Whiterock Ct
- 10571 Glen Hannah Dr
- 10618 Whiterock Ct
- 10605 Whiterock Ct
- 10567 Glen Hannah Dr
- 10616 Whiterock Ct
- 10603 Whiterock Ct
Your Personal Tour Guide
Ask me questions while you tour the home.