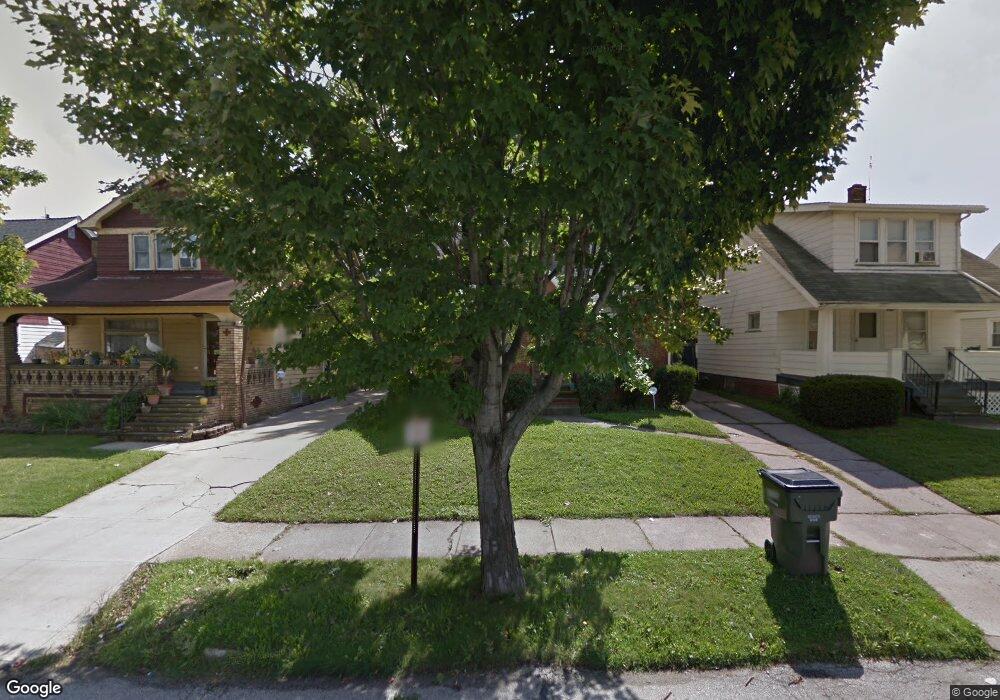
10624 Langton Ave Cleveland, OH 44125
Estimated Value: $91,000 - $135,000
3
Beds
1
Bath
744
Sq Ft
$147/Sq Ft
Est. Value
About This Home
This home is located at 10624 Langton Ave, Cleveland, OH 44125 and is currently estimated at $109,640, approximately $147 per square foot. 10624 Langton Ave is a home located in Cuyahoga County with nearby schools including Garfield Heights High School, North Shore High School, and Trinity High School.
Ownership History
Date
Name
Owned For
Owner Type
Purchase Details
Closed on
Oct 15, 2020
Sold by
J & J Property Services Llc
Bought by
Nz Enterprises Llc
Current Estimated Value
Purchase Details
Closed on
Dec 26, 2014
Sold by
Tabb Daphene R
Bought by
J & J Property Services Llc
Purchase Details
Closed on
Dec 8, 2005
Sold by
Tabb Daphene R and Tabb Ronald
Bought by
Tabb Daphene R
Home Financials for this Owner
Home Financials are based on the most recent Mortgage that was taken out on this home.
Original Mortgage
$88,200
Interest Rate
8.4%
Mortgage Type
Purchase Money Mortgage
Purchase Details
Closed on
Mar 19, 2001
Sold by
Phillips Hazel H
Bought by
Young Daphene R
Home Financials for this Owner
Home Financials are based on the most recent Mortgage that was taken out on this home.
Original Mortgage
$79,050
Interest Rate
7.03%
Purchase Details
Closed on
Jul 14, 1975
Sold by
Phillips Anthony P and Phillips Hazel H
Bought by
Phillips Hazel H
Purchase Details
Closed on
Jan 1, 1975
Bought by
Phillips Anthony P and Phillips Hazel H
Create a Home Valuation Report for This Property
The Home Valuation Report is an in-depth analysis detailing your home's value as well as a comparison with similar homes in the area
Home Values in the Area
Average Home Value in this Area
Purchase History
| Date | Buyer | Sale Price | Title Company |
|---|---|---|---|
| Nz Enterprises Llc | $40,000 | Harvard Title | |
| J & J Property Services Llc | $22,144 | Northstar Title Agency | |
| Tabb Daphene R | -- | -- | |
| Young Daphene R | $77,500 | Insignia Title Agency Ltd | |
| Phillips Hazel H | -- | -- | |
| Phillips Anthony P | -- | -- |
Source: Public Records
Mortgage History
| Date | Status | Borrower | Loan Amount |
|---|---|---|---|
| Previous Owner | Tabb Daphene R | $88,200 | |
| Previous Owner | Young Daphene R | $79,050 |
Source: Public Records
Tax History Compared to Growth
Tax History
| Year | Tax Paid | Tax Assessment Tax Assessment Total Assessment is a certain percentage of the fair market value that is determined by local assessors to be the total taxable value of land and additions on the property. | Land | Improvement |
|---|---|---|---|---|
| 2024 | $3,362 | $31,570 | $7,000 | $24,570 |
| 2023 | $2,544 | $21,880 | $4,760 | $17,120 |
| 2022 | $2,505 | $21,880 | $4,760 | $17,120 |
| 2021 | $2,646 | $21,880 | $4,760 | $17,120 |
| 2020 | $2,281 | $17,500 | $3,820 | $13,690 |
| 2019 | $2,935 | $50,000 | $10,900 | $39,100 |
| 2018 | $2,349 | $17,500 | $3,820 | $13,690 |
| 2017 | $2,330 | $16,980 | $3,050 | $13,930 |
| 2016 | $2,363 | $16,980 | $3,050 | $13,930 |
| 2015 | $22,144 | $16,980 | $3,050 | $13,930 |
| 2014 | $22,144 | $20,720 | $3,710 | $17,010 |
Source: Public Records
Map
Nearby Homes
- 4953 E 106th St
- 4948 E 107th St
- 10718 Vernon Ave
- 4885 E 107th St
- 10717 Park Heights Ave
- 4935 E 109th St
- 10501 Park Heights Ave
- 10506 Park Heights Ave
- 10209 Runnymede Ave
- 4846 Edgepark Dr
- 10609 Mccracken Blvd
- 11105 Vernon Ave
- 10016 Park Heights Ave
- 10916 Mccracken Rd
- 10403 Russell Ave
- 11209 Langton Ave
- 11006 Mccracken Rd
- 11215 Langton Ave
- 11206 Park Heights Ave
- 11016 Mccracken Rd
- 10702 Langton Ave
- 10618 Langton Ave
- 10706 Langton Ave
- 10614 Langton Ave
- 10623 Wadsworth Ave
- 10617 Wadsworth Ave
- 10621 Wadsworth Ave
- 10710 Langton Ave
- 10610 Langton Ave
- 10613 Wadsworth Ave
- 10705 Wadsworth Ave
- 4953 E 107th St
- 4952 E 107th St
- 10709 Wadsworth Ave
- 10609 Wadsworth Ave
- 10714 Langton Ave
- 10606 Langton Ave
- 4949 E 107th St
- 10711 Wadsworth Ave
- 10605 Wadsworth Ave