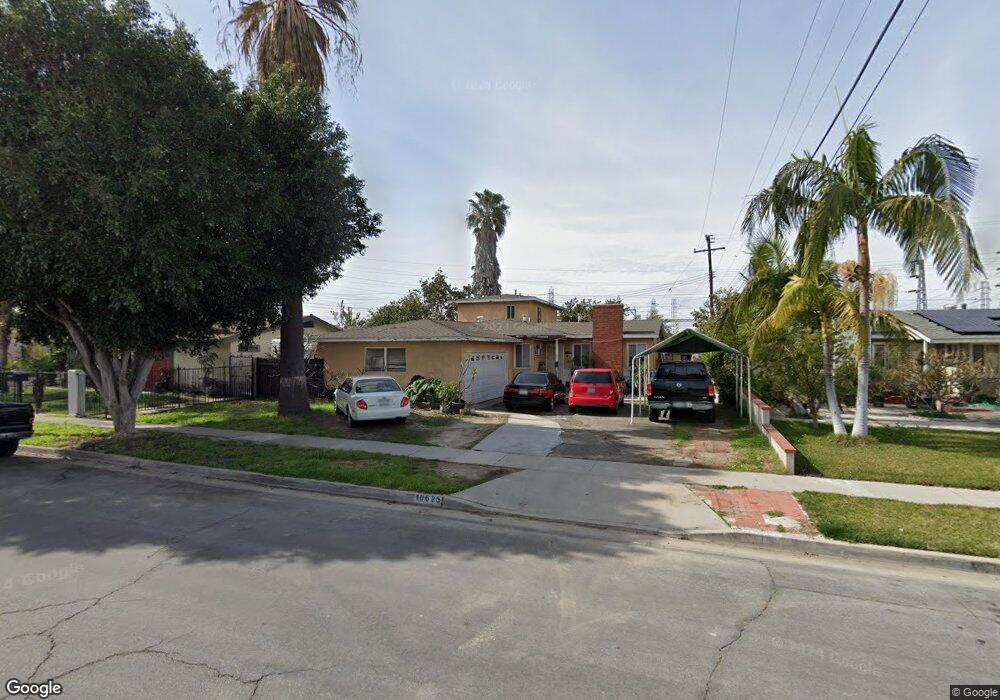
10625 Sherrill St Anaheim, CA 92804
West Anaheim NeighborhoodEstimated Value: $1,015,000 - $1,184,000
5
Beds
3
Baths
1,954
Sq Ft
$554/Sq Ft
Est. Value
About This Home
This home is located at 10625 Sherrill St, Anaheim, CA 92804 and is currently estimated at $1,082,159, approximately $553 per square foot. 10625 Sherrill St is a home located in Orange County with nearby schools including Esther L. Walter Elementary School, Dale Jr High School, and Magnolia High.
Ownership History
Date
Name
Owned For
Owner Type
Purchase Details
Closed on
May 25, 2001
Sold by
Briceno Jose Luis and Briceno Elizabeth
Bought by
Briceno Jose Luis and Briceno Elizabeth
Current Estimated Value
Home Financials for this Owner
Home Financials are based on the most recent Mortgage that was taken out on this home.
Original Mortgage
$175,000
Interest Rate
7.14%
Purchase Details
Closed on
Jul 17, 1998
Sold by
Claudia Briceno Maria
Bought by
Briceno Jose Luis and Briceno Elizabeth
Purchase Details
Closed on
Aug 31, 1994
Sold by
Cervantes Felipe and Cervantes Rosalia
Bought by
Briceno Maria Claudia and Briceno Jose Luis
Purchase Details
Closed on
Jul 19, 1993
Sold by
Phelps James Franklin and Phelps Lorraine Mae
Bought by
Briceno Maria Claudia and Cervantes Felipe
Home Financials for this Owner
Home Financials are based on the most recent Mortgage that was taken out on this home.
Original Mortgage
$185,250
Interest Rate
4.87%
Create a Home Valuation Report for This Property
The Home Valuation Report is an in-depth analysis detailing your home's value as well as a comparison with similar homes in the area
Home Values in the Area
Average Home Value in this Area
Purchase History
| Date | Buyer | Sale Price | Title Company |
|---|---|---|---|
| Briceno Jose Luis | -- | American Title Co | |
| Briceno Jose Luis | -- | -- | |
| Briceno Maria Claudia | -- | -- | |
| Briceno Maria Claudia | $195,000 | United Title Company |
Source: Public Records
Mortgage History
| Date | Status | Borrower | Loan Amount |
|---|---|---|---|
| Closed | Briceno Jose Luis | $175,000 | |
| Previous Owner | Briceno Maria Claudia | $185,250 |
Source: Public Records
Tax History Compared to Growth
Tax History
| Year | Tax Paid | Tax Assessment Tax Assessment Total Assessment is a certain percentage of the fair market value that is determined by local assessors to be the total taxable value of land and additions on the property. | Land | Improvement |
|---|---|---|---|---|
| 2025 | $3,834 | $321,221 | $231,479 | $89,742 |
| 2024 | $3,834 | $314,923 | $226,940 | $87,983 |
| 2023 | $3,735 | $308,749 | $222,491 | $86,258 |
| 2022 | $3,697 | $302,696 | $218,129 | $84,567 |
| 2021 | $3,653 | $296,761 | $213,852 | $82,909 |
| 2020 | $3,629 | $293,719 | $211,660 | $82,059 |
| 2019 | $3,541 | $287,960 | $207,510 | $80,450 |
| 2018 | $3,496 | $282,314 | $203,441 | $78,873 |
| 2017 | $3,375 | $276,779 | $199,452 | $77,327 |
| 2016 | $3,358 | $271,352 | $195,541 | $75,811 |
| 2015 | $3,324 | $267,277 | $192,604 | $74,673 |
| 2014 | $3,165 | $262,042 | $188,831 | $73,211 |
Source: Public Records
Map
Nearby Homes
- 2631 W Cerritos Ave
- 10800 Dale Ave Unit 129
- 10800 Dale Ave Unit 705
- 8681 Katella Ave
- 8681 Katella Ave Unit 897
- 8681 Katella Ave Unit 914
- 8681 Katella Ave Unit 861
- 9041 Stacie Ln Unit 12
- 10211 Macduff St
- 9155 Pacific Ave Unit 265
- 2533 W Chanticleer Rd
- 8921 Kennelly Ln
- 90093 Stacie Ln
- 8971 Poinsettia Ln
- 9272 Cerritos Ave
- 1234 S Macduff St
- 10661 Fern Ave
- 8532 Adah St
- 1223 S Dale Ave
- 11222 Magnolia St
- 10613 Sherrill St
- 10631 Sherrill St
- 10641 Sherrill St
- 10601 Sherrill St
- 10624 Sherrill St
- 8800 Stardust Ln
- 10651 Sherrill St
- 10589 Sherrill St
- 8830 Tina Way
- 8812 Stardust Ln
- 10661 Sherrill St
- 10577 Sherrill St
- 8840 Tina Way
- 10625 Sylvan St
- 8805 Stardust Ln
- 10671 Sherrill St
- 8824 Stardust Ln
- 8850 Tina Way
- 10557 Sherrill St
- 8817 Stardust Ln