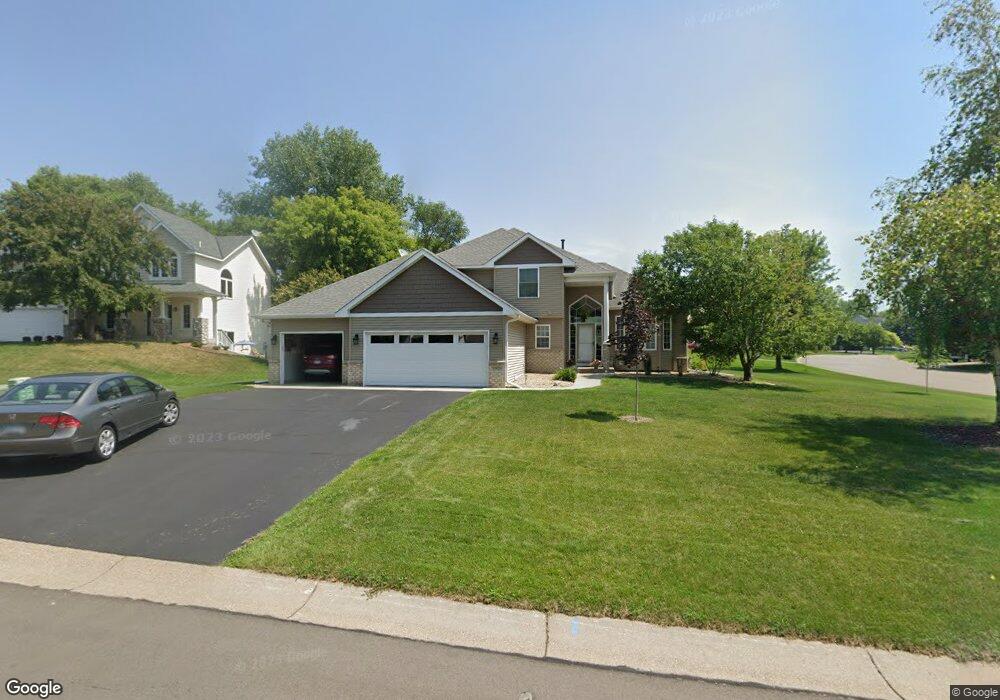
10626 Alvin Ct Inver Grove Heights, MN 55077
Estimated Value: $613,755 - $686,000
4
Beds
4
Baths
3,562
Sq Ft
$183/Sq Ft
Est. Value
About This Home
This home is located at 10626 Alvin Ct, Inver Grove Heights, MN 55077 and is currently estimated at $651,939, approximately $183 per square foot. 10626 Alvin Ct is a home located in Dakota County with nearby schools including Red Pine Elementary School, Rosemount Middle School, and Rosemount Senior High School.
Ownership History
Date
Name
Owned For
Owner Type
Purchase Details
Closed on
Dec 29, 2020
Sold by
Balfany Justin and Balfany Nichole E
Bought by
Paumen Eric and Paumen Jennifer
Current Estimated Value
Home Financials for this Owner
Home Financials are based on the most recent Mortgage that was taken out on this home.
Original Mortgage
$290,000
Outstanding Balance
$258,323
Interest Rate
2.6%
Mortgage Type
New Conventional
Estimated Equity
$393,616
Purchase Details
Closed on
Oct 21, 2011
Sold by
Steller Keith M and Steller Robin M
Bought by
Balfany Nicole E and Balfany Ryan J
Home Financials for this Owner
Home Financials are based on the most recent Mortgage that was taken out on this home.
Original Mortgage
$317,735
Interest Rate
4.4%
Mortgage Type
FHA
Purchase Details
Closed on
Jun 23, 2000
Sold by
Metro Classic Homes Inc
Bought by
Steller Keith M and Steller Robin M
Purchase Details
Closed on
Mar 14, 2000
Sold by
Lyman Development Co
Bought by
Metro Classic Homes Inc
Create a Home Valuation Report for This Property
The Home Valuation Report is an in-depth analysis detailing your home's value as well as a comparison with similar homes in the area
Home Values in the Area
Average Home Value in this Area
Purchase History
| Date | Buyer | Sale Price | Title Company |
|---|---|---|---|
| Paumen Eric | $465,000 | Titlesmart Inc | |
| Balfany Nicole E | $326,000 | Trademark Title Services | |
| Steller Keith M | $282,540 | -- | |
| Metro Classic Homes Inc | $60,900 | -- | |
| Paumen Eric Eric | $465,000 | -- |
Source: Public Records
Mortgage History
| Date | Status | Borrower | Loan Amount |
|---|---|---|---|
| Open | Paumen Eric | $290,000 | |
| Previous Owner | Balfany Nicole E | $317,735 | |
| Closed | Paumen Eric Eric | $288,027 |
Source: Public Records
Tax History Compared to Growth
Tax History
| Year | Tax Paid | Tax Assessment Tax Assessment Total Assessment is a certain percentage of the fair market value that is determined by local assessors to be the total taxable value of land and additions on the property. | Land | Improvement |
|---|---|---|---|---|
| 2024 | $6,824 | $566,600 | $129,800 | $436,800 |
| 2023 | $6,824 | $538,100 | $126,500 | $411,600 |
| 2022 | $6,244 | $541,900 | $126,400 | $415,500 |
| 2021 | $6,294 | $486,900 | $109,900 | $377,000 |
| 2020 | $6,360 | $486,000 | $104,700 | $381,300 |
| 2019 | $6,168 | $478,100 | $99,700 | $378,400 |
| 2018 | $5,594 | $440,300 | $94,900 | $345,400 |
| 2017 | $5,755 | $426,800 | $90,400 | $336,400 |
| 2016 | $5,226 | $408,800 | $86,100 | $322,700 |
| 2015 | $4,934 | $390,258 | $83,584 | $306,674 |
| 2014 | -- | $375,761 | $80,230 | $295,531 |
| 2013 | -- | $337,175 | $74,110 | $263,065 |
Source: Public Records
Map
Nearby Homes
- 4525 Alicia Dr
- 10787 Alison Way
- 10612 Alison Way
- 10684 Alameda Ave
- 4168 Countryview Dr
- 10064 Adam Ave
- 676 N Hay Lake Rd
- 591 Autumn Oaks Ct
- 695 Rosa Ct
- 4829 Redpoll Ct
- 11700 Azure Ln
- 4837 Avery Ct
- 9380 Aladin Trail
- 4860 Avery Ct
- 11735 Azure Cir
- 11732 Azure Cir
- 11784 Azure Ln
- 11798 Azure Ln
- 4080 Camberwell Dr N
- 4001 Haven Woods Ct
- 10618 Alvin Ct
- 10669 Alison Way
- 10668 Alison Way
- 10627 Alvin Ct
- 10665 Alison Way
- 10606 Alvin Ct
- 10619 Alvin Ct
- 10680 Alison Way
- 10672 Alison Way
- 10664 Alison Way
- 10601 Alvin Ct
- 10645 Amery Ct
- 10676 Alison Way
- 10609 Alvin Ct
- 10601 Amery Cir
- 10684 Alison Way
- 75XX Alvin Ct
- 10591 Amery Cir
- 10660 Alison Way
- 10668 Alton Ct