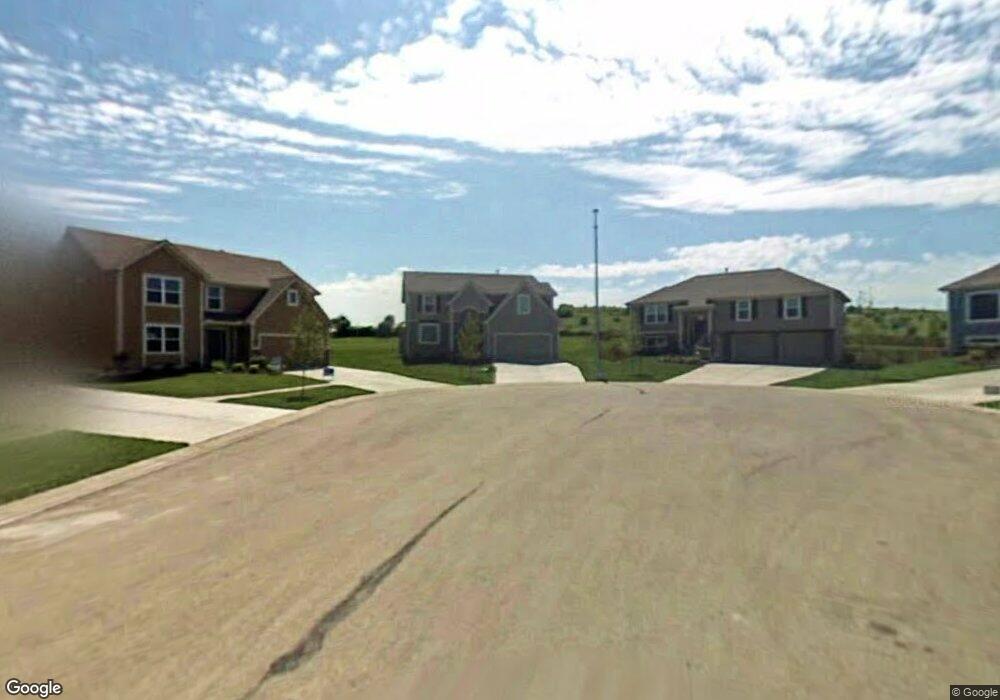
1063 Allyssa Ct Lansing, KS 66043
Estimated Value: $381,000 - $430,000
4
Beds
4
Baths
2,194
Sq Ft
$183/Sq Ft
Est. Value
About This Home
This home is located at 1063 Allyssa Ct, Lansing, KS 66043 and is currently estimated at $400,477, approximately $182 per square foot. 1063 Allyssa Ct is a home located in Leavenworth County with nearby schools including Lansing Elementary School, Lansing Middle 6-8, and Lansing High 9-12.
Ownership History
Date
Name
Owned For
Owner Type
Purchase Details
Closed on
Nov 7, 2013
Sold by
Earl Brian D
Bought by
Brown Mark A and Brown Elizabeth R
Current Estimated Value
Home Financials for this Owner
Home Financials are based on the most recent Mortgage that was taken out on this home.
Original Mortgage
$205,031
Outstanding Balance
$153,747
Interest Rate
4.37%
Mortgage Type
VA
Estimated Equity
$246,730
Create a Home Valuation Report for This Property
The Home Valuation Report is an in-depth analysis detailing your home's value as well as a comparison with similar homes in the area
Home Values in the Area
Average Home Value in this Area
Purchase History
| Date | Buyer | Sale Price | Title Company |
|---|---|---|---|
| Brown Mark A | $200,930 | Mccaffree-Short Title Co Inc |
Source: Public Records
Mortgage History
| Date | Status | Borrower | Loan Amount |
|---|---|---|---|
| Open | Brown Mark A | $205,031 |
Source: Public Records
Tax History Compared to Growth
Tax History
| Year | Tax Paid | Tax Assessment Tax Assessment Total Assessment is a certain percentage of the fair market value that is determined by local assessors to be the total taxable value of land and additions on the property. | Land | Improvement |
|---|---|---|---|---|
| 2025 | $5,568 | $42,607 | $5,889 | $36,718 |
| 2024 | $5,371 | $41,250 | $5,889 | $35,361 |
| 2023 | $5,371 | $41,250 | $5,889 | $35,361 |
| 2022 | $5,105 | $37,075 | $4,172 | $32,903 |
| 2021 | $4,660 | $32,338 | $4,172 | $28,166 |
| 2020 | $4,325 | $29,555 | $4,172 | $25,383 |
| 2019 | $4,159 | $28,393 | $4,172 | $24,221 |
| 2018 | $4,090 | $27,937 | $4,172 | $23,765 |
| 2017 | $3,880 | $26,459 | $4,172 | $22,287 |
| 2016 | $3,843 | $26,197 | $4,172 | $22,025 |
| 2015 | $3,923 | $26,818 | $4,172 | $22,646 |
| 2014 | $3,706 | $25,875 | $4,172 | $21,703 |
Source: Public Records
Map
Nearby Homes
- 922 Southfork St
- 811 4-H Rd
- 866 Clearview Dr
- 875 Clearview Dr
- 1322 Rock Creek Ct
- 1221 S Desoto Rd
- 527 S Valley Dr
- 833 Rock Creek Dr
- 104 Olive St
- 522 Forestglen Ln
- 202 S Main St
- 124 S Main St
- 24431 139th St
- 546 Hithergreen Dr
- 13788 McIntyre1 Rd
- 13788 Mcintyre Rd
- 13788 McIntyre2 Rd
- 13965 Mc Intyre Rd
- 218 E Kay St
- 20958 Ida St
- 1061 Allyssa Ct
- 1062 Allyssa Ct
- 00000 Southfork Rd
- 00000 Southfork Rd Unit 2+/- Acres
- 1059 Allyssa Ct
- 1060 Allyssa Ct
- 1057 Allyssa Ct
- 1058 Allyssa Ct
- 501 Johnson Dr
- 1052 Wyndham Dr
- 1054 Wyndham Dr
- 1056 Wyndham Dr
- 1050 Wyndham Dr
- 1051 Allyssa Ct
- 938 Wyndham Dr
- 1053 Wyndham Dr
- 1057 Wyndham Dr
- 1051 Wyndham Dr
- 936 Wyndham Dr
- 1047 Allyssa Ct