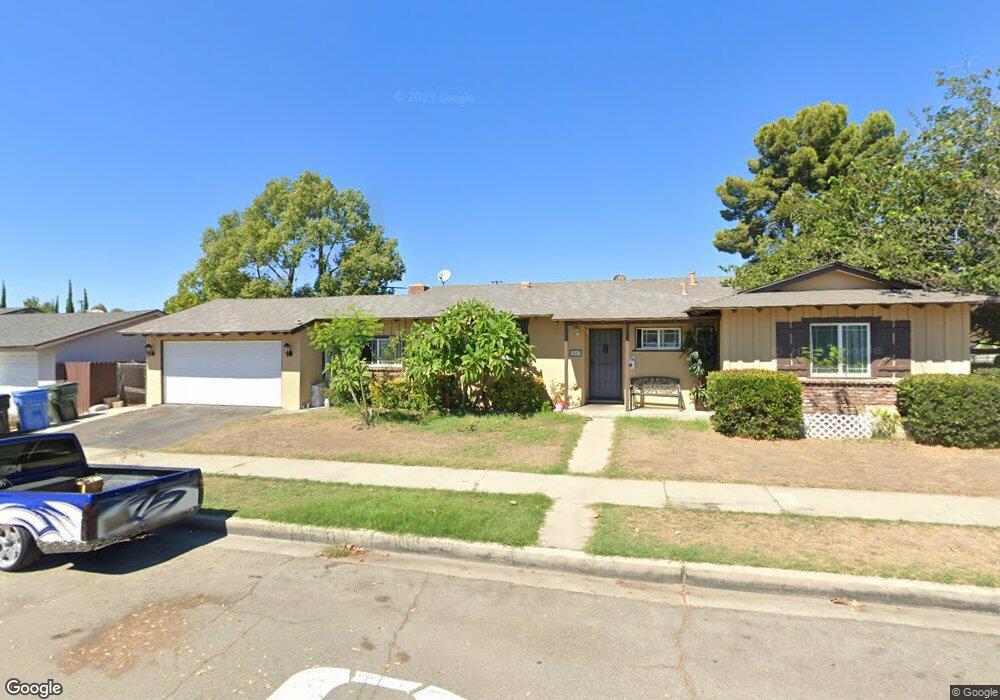
1063 Baldwin Ave Pomona, CA 91767
Pomona East NeighborhoodEstimated Value: $643,000 - $757,000
3
Beds
2
Baths
1,797
Sq Ft
$391/Sq Ft
Est. Value
About This Home
This home is located at 1063 Baldwin Ave, Pomona, CA 91767 and is currently estimated at $702,359, approximately $390 per square foot. 1063 Baldwin Ave is a home located in Los Angeles County with nearby schools including Allison Elementary School, Emerson Middle School, and Pomona High School.
Ownership History
Date
Name
Owned For
Owner Type
Purchase Details
Closed on
Nov 24, 2008
Sold by
Rendon Raplh
Bought by
Guzman Javier and Guzman Nina
Current Estimated Value
Home Financials for this Owner
Home Financials are based on the most recent Mortgage that was taken out on this home.
Original Mortgage
$172,000
Outstanding Balance
$114,973
Interest Rate
6.37%
Mortgage Type
Purchase Money Mortgage
Estimated Equity
$587,386
Purchase Details
Closed on
Mar 9, 2006
Sold by
Griffith Stephanie
Bought by
Rendon Ralph
Home Financials for this Owner
Home Financials are based on the most recent Mortgage that was taken out on this home.
Original Mortgage
$352,000
Interest Rate
6.75%
Mortgage Type
Purchase Money Mortgage
Purchase Details
Closed on
Aug 18, 2000
Sold by
Marrufo Victor M and Marrufo Kathy
Bought by
Griffith Stephanie
Home Financials for this Owner
Home Financials are based on the most recent Mortgage that was taken out on this home.
Original Mortgage
$148,972
Interest Rate
7.98%
Mortgage Type
FHA
Create a Home Valuation Report for This Property
The Home Valuation Report is an in-depth analysis detailing your home's value as well as a comparison with similar homes in the area
Home Values in the Area
Average Home Value in this Area
Purchase History
| Date | Buyer | Sale Price | Title Company |
|---|---|---|---|
| Guzman Javier | $215,000 | First American Title Company | |
| Rendon Ralph | $440,000 | Chicago Title | |
| Griffith Stephanie | $150,500 | Stewart Title |
Source: Public Records
Mortgage History
| Date | Status | Borrower | Loan Amount |
|---|---|---|---|
| Open | Guzman Javier | $172,000 | |
| Previous Owner | Rendon Ralph | $352,000 | |
| Previous Owner | Griffith Stephanie | $148,972 |
Source: Public Records
Tax History
| Year | Tax Paid | Tax Assessment Tax Assessment Total Assessment is a certain percentage of the fair market value that is determined by local assessors to be the total taxable value of land and additions on the property. | Land | Improvement |
|---|---|---|---|---|
| 2025 | $3,703 | $276,850 | $104,944 | $171,906 |
| 2024 | $3,703 | $271,423 | $102,887 | $168,536 |
| 2023 | $3,630 | $266,102 | $100,870 | $165,232 |
| 2022 | $3,572 | $260,886 | $98,893 | $161,993 |
| 2021 | $3,486 | $255,771 | $96,954 | $158,817 |
| 2019 | $3,556 | $248,186 | $94,079 | $154,107 |
| 2018 | $3,264 | $243,321 | $92,235 | $151,086 |
| 2016 | $3,056 | $233,874 | $88,654 | $145,220 |
| 2015 | $3,030 | $230,362 | $87,323 | $143,039 |
| 2014 | $3,013 | $225,851 | $85,613 | $140,238 |
Source: Public Records
Map
Nearby Homes
- 1337 Loranne Ave
- 1369 Washington Ave
- 1545 Washington Ave
- 1441 Sheridan Ave
- 1113 San Bernardino Ave
- 1138 Ringe Ct
- 967 E Columbia Ave
- 1317 Caprino Way
- 1257 Claremont Place
- 1274 N San Antonio Ave
- 1946 San Simeon St
- 1324 -1340 E Kingsley Ave
- 1305 E Kingsley Ave
- 1837 Benedict Way
- 1830 Benedict Way
- 1836 Benedict Way
- 1380 E Kingsley Ave
- 548 N Reservoir St
- 964 E La Verne Ave
- 1989 Annandale Way
- 1451 Sebring St
- 1041 Baldwin Ave
- 1444 Loranne Ave
- 1457 Sebring St
- 1042 Baldwin Ave
- 1034 Baldwin Ave
- 1050 Baldwin Ave
- 1460 Loranne Ave
- 1079 Baldwin Ave
- 1444 Sebring St
- 1465 Sebring St
- 1414 Loranne Ave
- 1058 Baldwin Ave
- 1450 Sebring St
- 1472 Loranne Ave
- 1066 Baldwin Ave
- 1479 Sebring St
- 1474 Sebring St
- 1055 Blakely Ct
- 1047 Blakely Ct
Your Personal Tour Guide
Ask me questions while you tour the home.