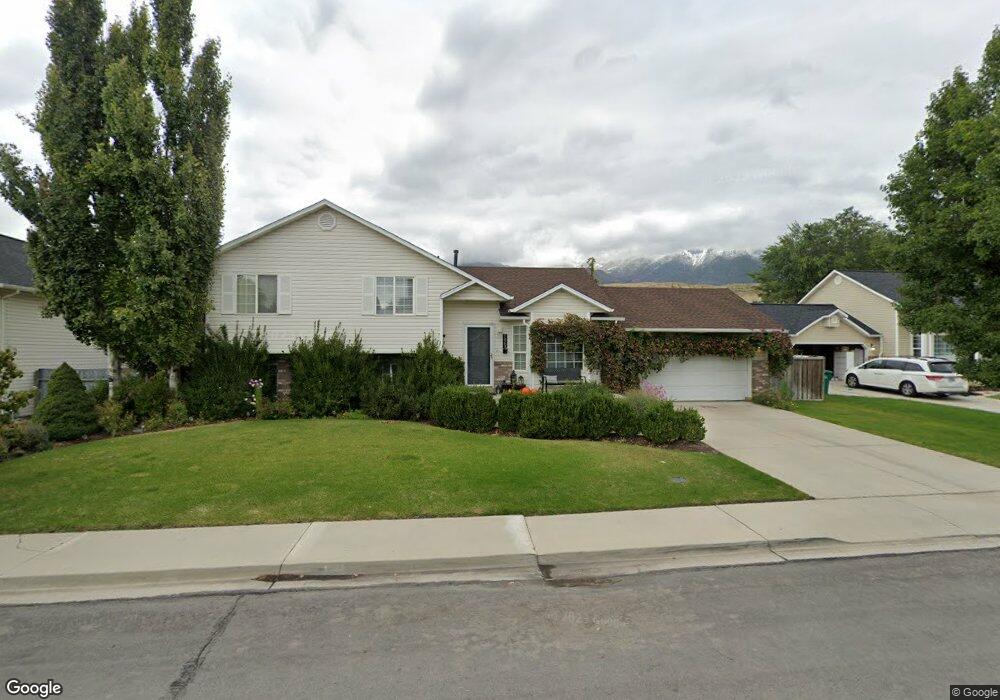
1063 E 760 N Orem, UT 84097
Orchard South NeighborhoodEstimated Value: $506,000 - $539,384
3
Beds
2
Baths
1,045
Sq Ft
$496/Sq Ft
Est. Value
About This Home
This home is located at 1063 E 760 N, Orem, UT 84097 and is currently estimated at $518,461, approximately $496 per square foot. 1063 E 760 N is a home located in Utah County with nearby schools including Foothill Elementary School, Canyon View Junior High School, and Orem High School.
Ownership History
Date
Name
Owned For
Owner Type
Purchase Details
Closed on
Aug 26, 2025
Sold by
Ely Gregory B
Bought by
Ely Suzanne H and Ely Matthew G
Current Estimated Value
Home Financials for this Owner
Home Financials are based on the most recent Mortgage that was taken out on this home.
Original Mortgage
$289,400
Outstanding Balance
$289,400
Interest Rate
6.75%
Mortgage Type
New Conventional
Estimated Equity
$229,061
Purchase Details
Closed on
Jan 15, 2006
Sold by
Ely Greg B and Ely Suzanne H
Bought by
Ely Gregory B
Home Financials for this Owner
Home Financials are based on the most recent Mortgage that was taken out on this home.
Original Mortgage
$192,600
Interest Rate
8.75%
Mortgage Type
Stand Alone First
Purchase Details
Closed on
Sep 25, 1998
Sold by
Ely Suzanne H
Bought by
Ely Greg B
Purchase Details
Closed on
Apr 13, 1998
Sold by
Ely Thora J
Bought by
Ely Suzanne H
Purchase Details
Closed on
Jun 12, 1997
Sold by
Panda Bear Homes Inc
Bought by
Ely Thora J
Home Financials for this Owner
Home Financials are based on the most recent Mortgage that was taken out on this home.
Original Mortgage
$140,000
Interest Rate
7.44%
Create a Home Valuation Report for This Property
The Home Valuation Report is an in-depth analysis detailing your home's value as well as a comparison with similar homes in the area
Home Values in the Area
Average Home Value in this Area
Purchase History
| Date | Buyer | Sale Price | Title Company |
|---|---|---|---|
| Ely Suzanne H | -- | Sutherland Title | |
| Ely Gregory B | -- | Wasatch Title Insurance Age | |
| Ely Greg B | -- | -- | |
| Ely Greg B | -- | -- | |
| Ely Suzanne H | -- | -- | |
| Ely Thora J | -- | -- |
Source: Public Records
Mortgage History
| Date | Status | Borrower | Loan Amount |
|---|---|---|---|
| Open | Ely Suzanne H | $289,400 | |
| Previous Owner | Ely Gregory B | $192,600 | |
| Previous Owner | Ely Thora J | $140,000 |
Source: Public Records
Tax History
| Year | Tax Paid | Tax Assessment Tax Assessment Total Assessment is a certain percentage of the fair market value that is determined by local assessors to be the total taxable value of land and additions on the property. | Land | Improvement |
|---|---|---|---|---|
| 2025 | $2,230 | $283,360 | -- | -- |
| 2024 | $2,230 | $272,690 | $0 | $0 |
| 2023 | $2,087 | $274,340 | $0 | $0 |
| 2022 | $2,123 | $270,325 | $0 | $0 |
| 2021 | $1,788 | $344,800 | $151,500 | $193,300 |
| 2020 | $1,639 | $310,700 | $121,200 | $189,500 |
| 2019 | $1,522 | $300,000 | $110,500 | $189,500 |
| 2018 | $1,443 | $271,800 | $107,000 | $164,800 |
| 2017 | $1,333 | $134,420 | $0 | $0 |
| 2016 | $1,297 | $120,670 | $0 | $0 |
| 2015 | $1,271 | $111,815 | $0 | $0 |
| 2014 | $1,239 | $108,460 | $0 | $0 |
Source: Public Records
Map
Nearby Homes
- 551 N 900 E
- 566 N Bella Vista Dr
- 976 N 560 E
- 453 N 650 E
- 471 E 700 N
- 710 E 1280 N
- 1324 N 750 E Unit 3
- 181 N 800 E
- 733 E 1450 N Unit 5
- 1356 N 750 E Unit 11
- 1366 N 750 E
- 150 N 750 E
- 747 E 1500 N Unit 13
- 713 E 1450 N Unit 23
- 362 E 800 N Unit 1
- 80 N 1200 E
- 713 E 1500 St N Unit 19
- 5005 N Edgewood Dr Unit 310
- 337 Birchwood Dr
- 372 E 1165 N
Your Personal Tour Guide
Ask me questions while you tour the home.