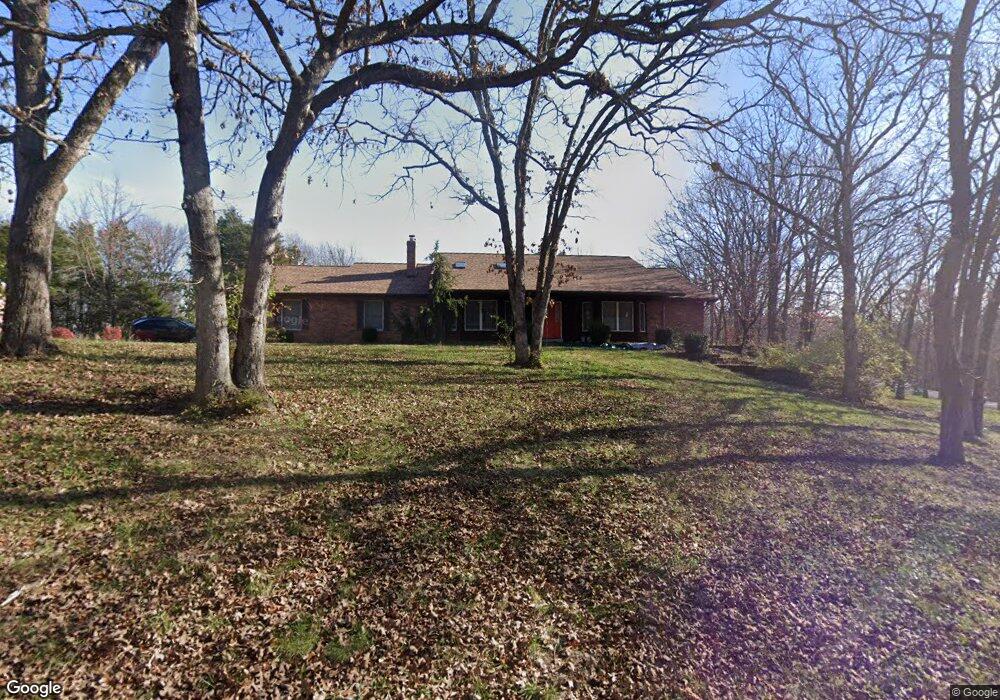
10632 Saint Andrews Ct Festus, MO 63028
Estimated Value: $521,000 - $605,000
Studio
2
Baths
2,010
Sq Ft
$274/Sq Ft
Est. Value
About This Home
This home is located at 10632 Saint Andrews Ct, Festus, MO 63028 and is currently estimated at $549,980, approximately $273 per square foot. 10632 Saint Andrews Ct is a home located in Jefferson County with nearby schools including Festus Intermediate School, Festus Elementary School, and Festus Middle School.
Ownership History
Date
Name
Owned For
Owner Type
Purchase Details
Closed on
Mar 12, 2025
Sold by
Wells Anna C
Bought by
Anna C Wells Revocable Trust and Wells
Current Estimated Value
Purchase Details
Closed on
Nov 29, 2005
Sold by
Kelly Leann J and The Leann J Kelly Revocable Tr
Bought by
Wells Milton C and Wells Anna C
Home Financials for this Owner
Home Financials are based on the most recent Mortgage that was taken out on this home.
Original Mortgage
$294,400
Interest Rate
6.12%
Mortgage Type
Fannie Mae Freddie Mac
Purchase Details
Closed on
Jun 14, 2005
Sold by
Kelly Leann J and Kelly Lawrence R
Bought by
Kelly Leann J and Kelly Lawrence R
Home Financials for this Owner
Home Financials are based on the most recent Mortgage that was taken out on this home.
Original Mortgage
$194,000
Interest Rate
5.78%
Mortgage Type
Credit Line Revolving
Create a Home Valuation Report for This Property
The Home Valuation Report is an in-depth analysis detailing your home's value as well as a comparison with similar homes in the area
Purchase History
| Date | Buyer | Sale Price | Title Company |
|---|---|---|---|
| Anna C Wells Revocable Trust | -- | None Listed On Document | |
| Wells Milton C | -- | Htc | |
| Kelly Leann J | -- | -- |
Source: Public Records
Mortgage History
| Date | Status | Borrower | Loan Amount |
|---|---|---|---|
| Previous Owner | Wells Milton C | $294,400 | |
| Previous Owner | Kelly Leann J | $194,000 |
Source: Public Records
Tax History
| Year | Tax Paid | Tax Assessment Tax Assessment Total Assessment is a certain percentage of the fair market value that is determined by local assessors to be the total taxable value of land and additions on the property. | Land | Improvement |
|---|---|---|---|---|
| 2025 | $3,581 | $67,700 | $11,700 | $56,000 |
| 2024 | $3,581 | $59,000 | $11,700 | $47,300 |
| 2023 | $3,581 | $59,000 | $11,700 | $47,300 |
| 2022 | $3,199 | $53,000 | $5,700 | $47,300 |
| 2021 | $3,202 | $53,000 | $5,700 | $47,300 |
| 2020 | $3,040 | $47,200 | $4,900 | $42,300 |
| 2019 | $3,039 | $47,200 | $4,900 | $42,300 |
| 2018 | $2,733 | $47,200 | $4,900 | $42,300 |
| 2017 | $2,543 | $47,200 | $4,900 | $42,300 |
| 2016 | $2,321 | $43,400 | $4,800 | $38,600 |
| 2015 | $2,262 | $43,400 | $4,800 | $38,600 |
| 2013 | $2,262 | $43,000 | $4,800 | $38,200 |
Source: Public Records
Map
Nearby Homes
- 0 Hwy A 62 Acres Unit 20012897
- 0 Bailey School Rd
- 10290 Woodland Rd
- 1950 W Main St
- 0
- 0 Tbb Birchwood Overlook - Maple
- 1829 Belmont Ct
- 11524 Ten Point Ln
- 1816 Belmont Ct
- 0 Tbb Birchwood Overlook-Dogwood Unit MAR24022693
- 716 Rosemary Ln
- 0 Tbb Birchwood Overlook Birchwo Unit MAR24022701
- 115 Valley Vue Place
- 0 Tbb Birchwood Overlook-Red Bud Unit MAR24022708
- 1833 Sunset Ridge
- 301 Meadow Chase Dr
- 0 Tbb Birchwood Overlook-Hickory
- 0 Tbb Bichwood Overlook-Sycamore Unit MAR24022712
- TBD Cedar Ln
- 131 Blue Ridge Trace
- 10616 Saint Andrews Ct
- 10621 Saint Andrews Ct
- 10648 Saint Andrews Ct
- 10608 Saint Andrews Ct
- 10607 Saint Andrews Ct
- 10653 Saint Andrews Ct
- 10637 Saint Andrews Ct
- 10629 Saint Andrews Ct
- 10600 Saint Andrews Ct
- 0TBB Falls@ Ltl Crk-Breckenridge II
- 3208 Burning Tree Ln
- 0TBB Falls at Little Creek-Aspen II
- 0TBB the Falls @ Ltl Crk- Littleton
- 0TBB the Falls @ Ltl Crk- Frisco II
- 10645 Saint Andrews Ct
- 0TBB Falls @ Little Creek-Pagosa II
- 0TBB Falls @ Ltl Creek-Montrose II
- 217 Sutherland Falls Ct
- 221 Sutherland Falls Ct
- 225 Sutherland Falls Ct
Your Personal Tour Guide
Ask me questions while you tour the home.