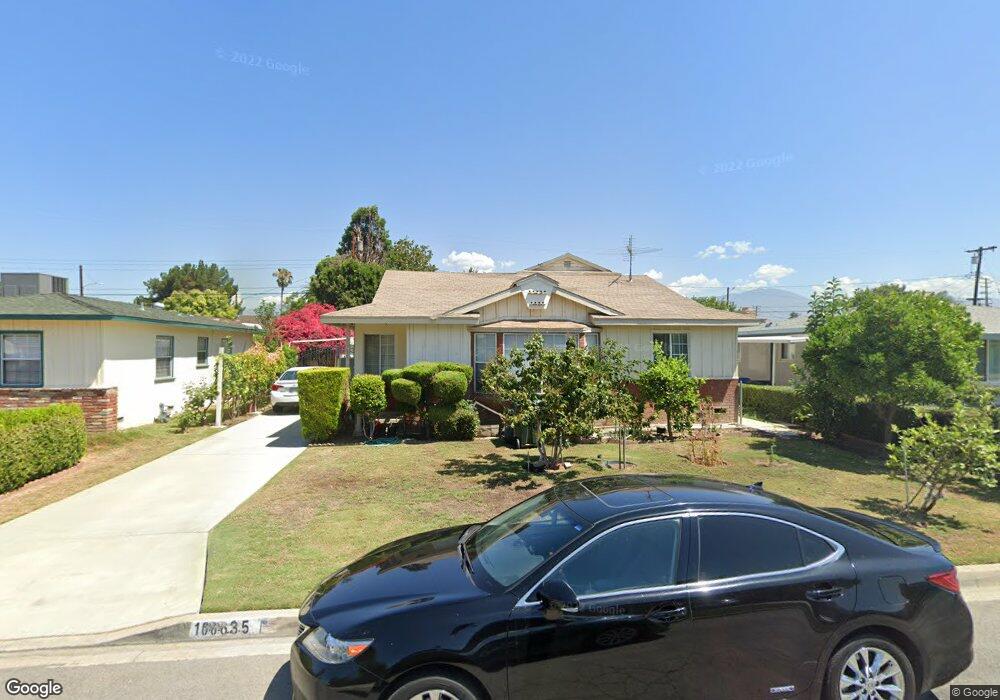
10635 Sparklett St Temple City, CA 91780
Estimated Value: $994,000 - $1,112,000
4
Beds
2
Baths
1,822
Sq Ft
$580/Sq Ft
Est. Value
About This Home
This home is located at 10635 Sparklett St, Temple City, CA 91780 and is currently estimated at $1,057,228, approximately $580 per square foot. 10635 Sparklett St is a home located in Los Angeles County with nearby schools including Gidley Elementary School, Rosemead High School, and Shield of Faith Christian School.
Ownership History
Date
Name
Owned For
Owner Type
Purchase Details
Closed on
Jan 16, 2009
Sold by
Us Bank National Association
Bought by
Mah Buck Fon
Current Estimated Value
Home Financials for this Owner
Home Financials are based on the most recent Mortgage that was taken out on this home.
Original Mortgage
$350,000
Interest Rate
4.92%
Mortgage Type
Purchase Money Mortgage
Purchase Details
Closed on
Sep 25, 2008
Sold by
Pena Zeferino Cesar
Bought by
Us Bank Na
Purchase Details
Closed on
Apr 7, 2006
Sold by
Pena Zeferino Cesar and Mares Maria Elvia
Bought by
Pena Zeferino Cesar
Home Financials for this Owner
Home Financials are based on the most recent Mortgage that was taken out on this home.
Original Mortgage
$590,000
Interest Rate
7.99%
Mortgage Type
Balloon
Purchase Details
Closed on
Apr 20, 2005
Sold by
Pena Zeferino Cesar
Bought by
Mares Maria Elvia
Home Financials for this Owner
Home Financials are based on the most recent Mortgage that was taken out on this home.
Original Mortgage
$448,500
Interest Rate
6%
Mortgage Type
Fannie Mae Freddie Mac
Purchase Details
Closed on
Aug 18, 2004
Sold by
Mares Maria Elvia
Bought by
Pena Zeferino Cesar
Home Financials for this Owner
Home Financials are based on the most recent Mortgage that was taken out on this home.
Original Mortgage
$396,000
Interest Rate
7.5%
Mortgage Type
Purchase Money Mortgage
Purchase Details
Closed on
Jul 15, 2004
Sold by
Pung Lee and Ku Kang Shih
Bought by
Mares Maria Elvia
Home Financials for this Owner
Home Financials are based on the most recent Mortgage that was taken out on this home.
Original Mortgage
$396,000
Interest Rate
7.5%
Mortgage Type
Purchase Money Mortgage
Purchase Details
Closed on
Feb 6, 2002
Sold by
Pung Anne Yu
Bought by
Pung Lee
Home Financials for this Owner
Home Financials are based on the most recent Mortgage that was taken out on this home.
Original Mortgage
$116,000
Interest Rate
7.13%
Purchase Details
Closed on
Sep 7, 2001
Sold by
Pung Anne Yu
Bought by
Pung Anne Yu
Home Financials for this Owner
Home Financials are based on the most recent Mortgage that was taken out on this home.
Original Mortgage
$216,000
Interest Rate
6.99%
Mortgage Type
Credit Line Revolving
Purchase Details
Closed on
Dec 6, 1995
Sold by
Wang Michael
Bought by
Pung Anne Yu
Home Financials for this Owner
Home Financials are based on the most recent Mortgage that was taken out on this home.
Original Mortgage
$170,000
Interest Rate
7.48%
Create a Home Valuation Report for This Property
The Home Valuation Report is an in-depth analysis detailing your home's value as well as a comparison with similar homes in the area
Home Values in the Area
Average Home Value in this Area
Purchase History
| Date | Buyer | Sale Price | Title Company |
|---|---|---|---|
| Mah Buck Fon | $438,000 | Ticor Title Company | |
| Us Bank Na | $381,500 | Accommodation | |
| Pena Zeferino Cesar | -- | United Title Company Inland | |
| Mares Maria Elvia | -- | United Title Company Inland | |
| Pena Zeferino Cesar | -- | -- | |
| Mares Maria Elvia | $495,000 | Southland Title Company | |
| Pung Lee | -- | American Title Co | |
| Pung Anne Yu | -- | American Title Co | |
| Pung Anne Yu | -- | Chicago Title Insurance Co |
Source: Public Records
Mortgage History
| Date | Status | Borrower | Loan Amount |
|---|---|---|---|
| Previous Owner | Mah Buck Fon | $350,000 | |
| Previous Owner | Pena Zeferino Cesar | $590,000 | |
| Previous Owner | Mares Maria Elvia | $448,500 | |
| Previous Owner | Mares Maria Elvia | $396,000 | |
| Previous Owner | Pung Lee | $116,000 | |
| Previous Owner | Pung Anne Yu | $216,000 | |
| Previous Owner | Pung Anne Yu | $170,000 | |
| Closed | Pung Lee | $100,000 | |
| Closed | Mares Maria Elvia | $99,000 | |
| Closed | Mares Maria Elvia | $89,700 |
Source: Public Records
Tax History Compared to Growth
Tax History
| Year | Tax Paid | Tax Assessment Tax Assessment Total Assessment is a certain percentage of the fair market value that is determined by local assessors to be the total taxable value of land and additions on the property. | Land | Improvement |
|---|---|---|---|---|
| 2025 | $7,143 | $564,025 | $448,778 | $115,247 |
| 2024 | $7,143 | $552,967 | $439,979 | $112,988 |
| 2023 | $7,013 | $542,125 | $431,352 | $110,773 |
| 2022 | $6,794 | $531,496 | $422,895 | $108,601 |
| 2021 | $6,644 | $521,075 | $414,603 | $106,472 |
| 2019 | $6,757 | $505,621 | $402,306 | $103,315 |
| 2018 | $6,636 | $495,708 | $394,418 | $101,290 |
| 2016 | $6,354 | $476,460 | $379,103 | $97,357 |
| 2015 | $6,290 | $469,304 | $373,409 | $95,895 |
| 2014 | $6,025 | $460,112 | $366,095 | $94,017 |
Source: Public Records
Map
Nearby Homes
- 4946 El Monte Ave
- 4939 Doreen Ave
- 4800 Daleview Ave Unit 86
- 4800 Daleview Ave Unit 148
- 4800 Daleview Ave Unit 157
- 5240 Hallowell Ave
- 5138 Daleview Ave
- 5140 Arden Dr
- 4660 Whitney Dr
- 5323 Welland Ave
- 5436 Mcculloch Ave Unit F
- 5436 Mcculloch Ave Unit D
- 4911 Glickman Ave
- 4552 Shasta Place
- 5305 Glickman Ave
- 5616 Pal Mal Ave
- 5220 Myrtus Ave
- 5639 Persimmon Ave
- 5340 Village Circle Dr
- 5305 Tyler Ave
- 10641 Sparklett St
- 10629 Sparklett St
- 10650 Key West St
- 10644 Key St W
- 10656 Key West St
- 10647 Sparklett St
- 10656 Key St W
- 10644 Key West St
- 10634 Sparklett St
- 10640 Sparklett St
- 10660 Key West St
- 10628 Sparklett St
- 10653 Sparklett St
- 10644 Sparklett St
- 10619 Sparklett St
- 10666 Key West St
- 10666 Key St W
- 10650 Sparklett St
- 10632 Key West St
- 10618 Sparklett St