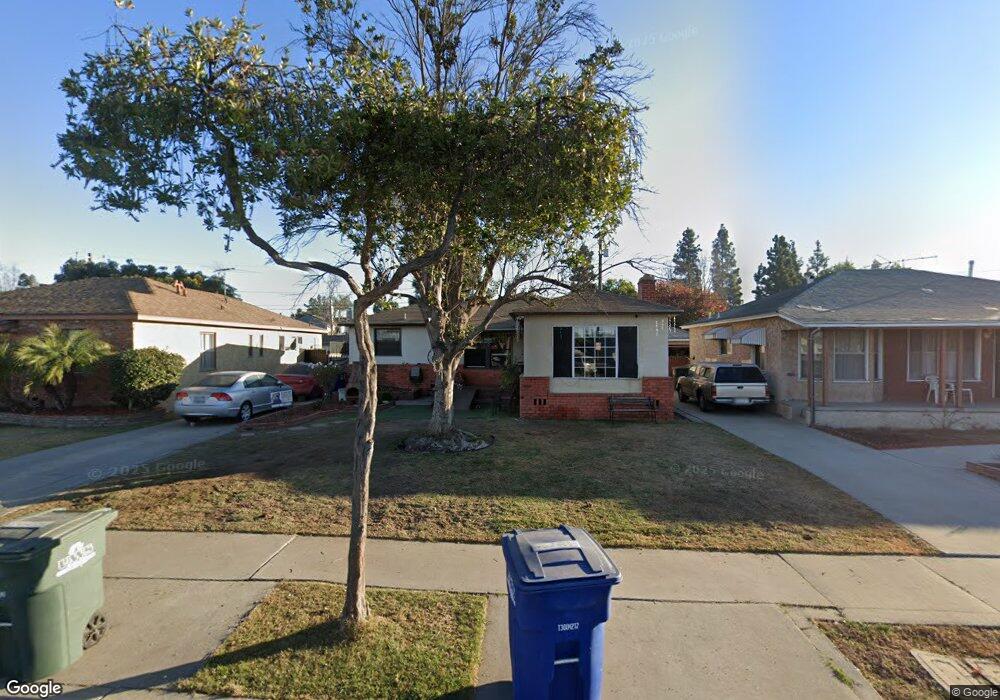
10636 Beak Ave South Gate, CA 90280
Estimated Value: $747,000 - $819,000
3
Beds
1
Bath
1,276
Sq Ft
$603/Sq Ft
Est. Value
About This Home
This home is located at 10636 Beak Ave, South Gate, CA 90280 and is currently estimated at $769,367, approximately $602 per square foot. 10636 Beak Ave is a home located in Los Angeles County with nearby schools including Old River Elementary School, Imperial Elementary School, and West Middle School.
Ownership History
Date
Name
Owned For
Owner Type
Purchase Details
Closed on
Oct 20, 2005
Sold by
Gonzalez Alonso Escalante and Martinez Jose A
Bought by
Gonzalez Alonso Escalante
Current Estimated Value
Home Financials for this Owner
Home Financials are based on the most recent Mortgage that was taken out on this home.
Original Mortgage
$168,500
Outstanding Balance
$100,823
Interest Rate
7.69%
Mortgage Type
New Conventional
Estimated Equity
$668,544
Purchase Details
Closed on
Jun 6, 1995
Sold by
Gonzalez Bertha
Bought by
Gonzalez Alonso Escalante
Purchase Details
Closed on
Mar 29, 1995
Sold by
Smith Margaret A
Bought by
Gonzalez Alonso Escalante
Home Financials for this Owner
Home Financials are based on the most recent Mortgage that was taken out on this home.
Original Mortgage
$154,628
Interest Rate
8.36%
Create a Home Valuation Report for This Property
The Home Valuation Report is an in-depth analysis detailing your home's value as well as a comparison with similar homes in the area
Home Values in the Area
Average Home Value in this Area
Purchase History
| Date | Buyer | Sale Price | Title Company |
|---|---|---|---|
| Gonzalez Alonso Escalante | -- | Sutic | |
| Gonzalez Alonso Escalante | -- | World Title | |
| Gonzalez Alonso Escalante | $172,000 | World Title |
Source: Public Records
Mortgage History
| Date | Status | Borrower | Loan Amount |
|---|---|---|---|
| Open | Gonzalez Alonso Escalante | $168,500 | |
| Previous Owner | Gonzalez Alonso Escalante | $154,628 |
Source: Public Records
Tax History Compared to Growth
Tax History
| Year | Tax Paid | Tax Assessment Tax Assessment Total Assessment is a certain percentage of the fair market value that is determined by local assessors to be the total taxable value of land and additions on the property. | Land | Improvement |
|---|---|---|---|---|
| 2025 | $6,307 | $481,279 | $354,288 | $126,991 |
| 2024 | $6,307 | $471,843 | $347,342 | $124,501 |
| 2023 | $6,098 | $462,592 | $340,532 | $122,060 |
| 2022 | $5,801 | $453,522 | $333,855 | $119,667 |
| 2021 | $5,698 | $444,630 | $327,309 | $117,321 |
| 2019 | $5,556 | $431,444 | $317,601 | $113,843 |
| 2018 | $5,362 | $422,985 | $311,374 | $111,611 |
| 2016 | $5,204 | $406,562 | $299,284 | $107,278 |
| 2015 | $4,824 | $374,000 | $276,000 | $98,000 |
| 2014 | $4,646 | $374,000 | $276,000 | $98,000 |
Source: Public Records
Map
Nearby Homes
- 7312 Quill Dr Unit 16
- 7328 Quill Dr Unit 110
- 7300 Quill Dr Unit 207
- 5950 Imperial Hwy
- 5950 Imperial Hwy Unit 2
- 5950 Imperial Hwy Unit 96
- 5950 Imperial Hwy Unit 48
- 5712 Glady St
- 7442 Hondo St
- 10537 Richlee Ave
- 12343 Rives Ave
- 12307 Rives Ave
- 7820 Springer St
- 7812 Borson St
- 11919 Susan Ave
- 12066 Horley Ave
- 7939 Lyndora St
- 9549 Karmont Ave
- 7640 Stewart And Gray Rd
- 10001 W Frontage Rd Unit 73
- 10644 Beak Ave
- 10632 Beak Ave
- 10700 Beak Ave
- 10628 Beak Ave
- 10706 Beak Ave
- 10624 Beak Ave
- 10637 Beak Ave
- 10633 Beak Ave
- 10710 Beak Ave
- 10618 Beak Ave
- 10627 Beak Ave
- 10707 Beak Ave
- 10716 Beak Ave
- 10705 Amery Ave
- 10614 Beak Ave
- 10630 Cassina Ave
- 10720 Beak Ave
- 10709 Amery Ave
- 10640 Cassina Ave
- 10636 Cassina Ave