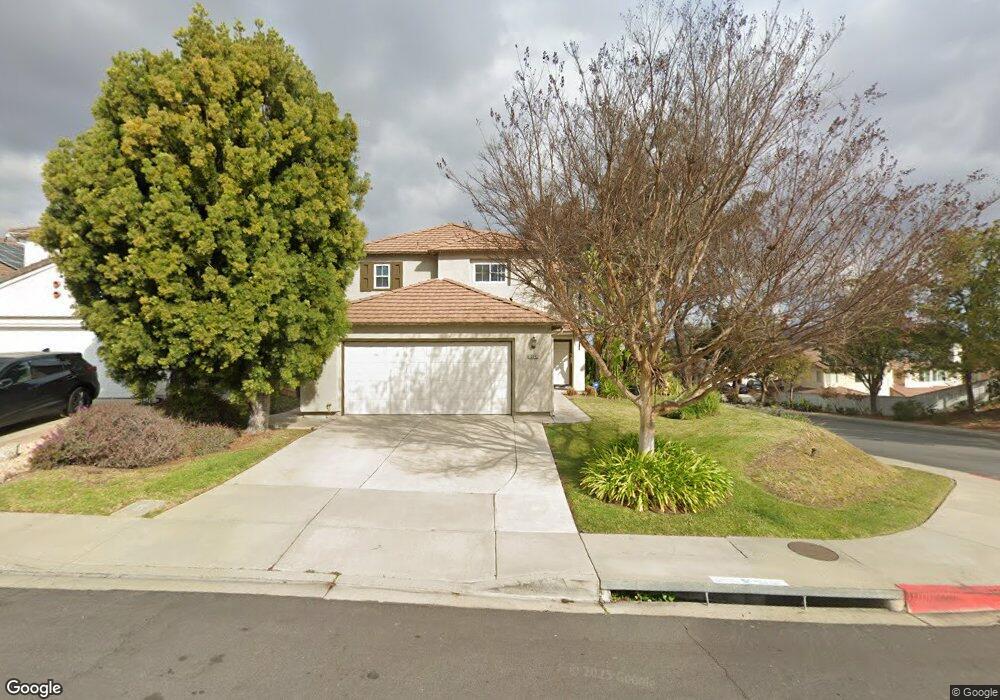
10642 Wincheck Rd San Diego, CA 92131
Miramar Ranch North NeighborhoodEstimated Value: $1,354,000 - $1,583,000
4
Beds
3
Baths
1,961
Sq Ft
$727/Sq Ft
Est. Value
About This Home
This home is located at 10642 Wincheck Rd, San Diego, CA 92131 and is currently estimated at $1,425,688, approximately $727 per square foot. 10642 Wincheck Rd is a home located in San Diego County with nearby schools including Dingeman Elementary School, Thurgood Marshall Middle School, and Scripps Ranch High School.
Ownership History
Date
Name
Owned For
Owner Type
Purchase Details
Closed on
Aug 6, 2021
Sold by
Stoen Clara Ling and Stoen Jeffrey
Bought by
Stoen Clara Ling and Stoen Jeffrey
Current Estimated Value
Purchase Details
Closed on
Apr 13, 2004
Sold by
Stoen Clara L and Ling Clara C
Bought by
Stoen Jeffrey D and Stoen Clara L
Home Financials for this Owner
Home Financials are based on the most recent Mortgage that was taken out on this home.
Original Mortgage
$262,000
Outstanding Balance
$120,967
Interest Rate
5.39%
Mortgage Type
New Conventional
Estimated Equity
$1,304,721
Purchase Details
Closed on
Jan 10, 2001
Sold by
Sievers Jeffrey H and Sievers Bonnie L
Bought by
Ling Clara C
Home Financials for this Owner
Home Financials are based on the most recent Mortgage that was taken out on this home.
Original Mortgage
$275,000
Interest Rate
7.08%
Purchase Details
Closed on
Mar 16, 1995
Sold by
Scripps Heatherwood Lp
Bought by
Sievers Jeffrey H and Sievers Bonnie Leigh
Home Financials for this Owner
Home Financials are based on the most recent Mortgage that was taken out on this home.
Original Mortgage
$199,600
Interest Rate
7.9%
Create a Home Valuation Report for This Property
The Home Valuation Report is an in-depth analysis detailing your home's value as well as a comparison with similar homes in the area
Home Values in the Area
Average Home Value in this Area
Purchase History
| Date | Buyer | Sale Price | Title Company |
|---|---|---|---|
| Stoen Clara Ling | -- | None Available | |
| Stoen Jeffrey D | -- | Fidelity National Title Co | |
| Ling Clara C | $395,000 | First American Title Co | |
| Sievers Jeffrey H | $218,000 | First American Title |
Source: Public Records
Mortgage History
| Date | Status | Borrower | Loan Amount |
|---|---|---|---|
| Open | Stoen Jeffrey D | $262,000 | |
| Closed | Ling Clara C | $275,000 | |
| Previous Owner | Sievers Jeffrey H | $199,600 |
Source: Public Records
Tax History Compared to Growth
Tax History
| Year | Tax Paid | Tax Assessment Tax Assessment Total Assessment is a certain percentage of the fair market value that is determined by local assessors to be the total taxable value of land and additions on the property. | Land | Improvement |
|---|---|---|---|---|
| 2025 | $7,584 | $595,176 | $218,509 | $376,667 |
| 2024 | $7,584 | $583,507 | $214,225 | $369,282 |
| 2023 | $7,407 | $572,067 | $210,025 | $362,042 |
| 2022 | $7,147 | $560,851 | $205,907 | $354,944 |
| 2021 | $7,086 | $549,855 | $201,870 | $347,985 |
| 2020 | $7,004 | $544,218 | $199,801 | $344,417 |
| 2019 | $7,181 | $533,548 | $195,884 | $337,664 |
| 2018 | $7,435 | $523,088 | $192,044 | $331,044 |
| 2017 | $80 | $512,832 | $188,279 | $324,553 |
| 2016 | $7,206 | $502,778 | $184,588 | $318,190 |
| 2015 | $7,118 | $495,227 | $181,816 | $313,411 |
| 2014 | $7,018 | $485,527 | $178,255 | $307,272 |
Source: Public Records
Map
Nearby Homes
- 10818 Caminito Arcada
- 11629 Swan Lake Dr Unit 4
- 10941 Waterton Rd
- 10914 Ivy Hill Dr Unit 1
- 11482 Cortina Place
- 11365 Affinity Ct Unit 192
- 11215 Affinity Ct Unit 80
- 9960 Scripps Vista Way Unit 116
- 9819 Kika Ct
- 11265 Affinity Ct Unit 103
- 12490 Heatherton Ct Unit 8
- 11175 Affinity Ct Unit 45
- 11235 Affinity Ct Unit 68
- 11856 Miro Cir
- 11825 Miro Cir
- 11325 Affinity Ct Unit 151
- 11115 Affinity Ct Unit 1
- 12530 Heatherton Ct Unit 31
- 10978 Serafina Ln Unit 69
- 11121 Catarina Ln Unit 73
- 10634 Wincheck Rd
- 10622 Wincheck Rd Unit 4
- 11845 Pickford Rd
- 11843 Pickford Rd
- 10650 Eglantine Ct
- 10653 Tipperary Way
- 11841 Pickford Rd
- 10655 Tipperary Way
- 10592 Wincheck Rd
- 10641 Wincheck Rd
- 10654 Eglantine Ct Unit 4A
- 10635 Wincheck Rd
- 11839 Pickford Rd
- 10621 Wincheck Rd
- 10663 Tipperary Way
- 10658 Eglantine Ct
- 10617 Wincheck Rd
- 10584 Wincheck Rd Unit 4
- 11833 Pickford Rd
- 10665 Tipperary Way