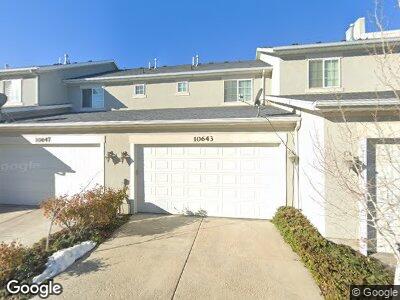
10643 S Granby Way South Jordan, UT 84095
Daybreak NeighborhoodEstimated Value: $381,000 - $392,000
2
Beds
3
Baths
1,784
Sq Ft
$217/Sq Ft
Est. Value
About This Home
This home is located at 10643 S Granby Way, South Jordan, UT 84095 and is currently estimated at $386,703, approximately $216 per square foot. 10643 S Granby Way is a home located in Salt Lake County with nearby schools including Eastlake Elementary School, Mountain Creek Middle School, and Herriman High School.
Ownership History
Date
Name
Owned For
Owner Type
Purchase Details
Closed on
May 27, 2016
Sold by
Walston Stephen and Walston Kathleen
Bought by
Parkinson Nichole W and The Dean And Cassidy White Trust
Current Estimated Value
Purchase Details
Closed on
Mar 28, 2012
Sold by
Secretary Of Hud
Bought by
Herd Brandie
Home Financials for this Owner
Home Financials are based on the most recent Mortgage that was taken out on this home.
Original Mortgage
$151,399
Interest Rate
3.83%
Mortgage Type
FHA
Purchase Details
Closed on
Oct 25, 2011
Sold by
Darger Tj and Casper Chelsie
Bought by
Wells Fargo Bank Na
Purchase Details
Closed on
Jun 6, 2008
Sold by
Db Towns Llc
Bought by
Darger T J and Casper Chelsie
Home Financials for this Owner
Home Financials are based on the most recent Mortgage that was taken out on this home.
Original Mortgage
$206,845
Interest Rate
6%
Mortgage Type
FHA
Create a Home Valuation Report for This Property
The Home Valuation Report is an in-depth analysis detailing your home's value as well as a comparison with similar homes in the area
Home Values in the Area
Average Home Value in this Area
Purchase History
| Date | Buyer | Sale Price | Title Company |
|---|---|---|---|
| Parkinson Nichole W | -- | First American Title | |
| Herd Brandie | -- | Williams Title Guaranty & Es | |
| Wells Fargo Bank Na | $237,573 | Etitle Insurance Agency | |
| Darger T J | -- | Meridian Title | |
| Db Towns Llc | -- | Meridian Title |
Source: Public Records
Mortgage History
| Date | Status | Borrower | Loan Amount |
|---|---|---|---|
| Previous Owner | Herd Brandie | $151,399 | |
| Previous Owner | Darger T J | $206,845 |
Source: Public Records
Tax History Compared to Growth
Tax History
| Year | Tax Paid | Tax Assessment Tax Assessment Total Assessment is a certain percentage of the fair market value that is determined by local assessors to be the total taxable value of land and additions on the property. | Land | Improvement |
|---|---|---|---|---|
| 2023 | $1,967 | $332,600 | $46,800 | $285,800 |
| 2022 | $1,910 | $335,300 | $45,900 | $289,400 |
| 2021 | $2,081 | $240,500 | $35,400 | $205,100 |
| 2020 | $1,447 | $218,500 | $33,300 | $185,200 |
| 2019 | $1,489 | $221,000 | $33,300 | $187,700 |
| 2018 | $1,408 | $208,000 | $34,800 | $173,200 |
| 2017 | $1,350 | $195,400 | $34,800 | $160,600 |
| 2016 | $1,411 | $193,500 | $34,800 | $158,700 |
| 2015 | $1,325 | $176,700 | $42,000 | $134,700 |
| 2014 | $1,236 | $180,900 | $67,700 | $113,200 |
Source: Public Records
Map
Nearby Homes
- 4489 W Milford Dr
- 4532 W Cave Run Ln
- 10611 S Oquirrh Lake Rd
- 10706 S Topview Rd
- 10519 S Oquirrh Lake Rd
- 10718 S Ozarks Dr
- 4477 S Jordan Pkwy W
- 4531 S Jordan Pkwy W
- 10763 S Ozarks Dr
- 10398 S Clarks Hill Dr Unit 104
- 10688 S Watery Way Unit 110
- 6364 Roaring Creek Ln Unit 105
- 6348 Roaring Creek Ln Unit 107
- 4438 W Enid Dr
- 4353 W Vermillion Dr
- 4627 W Zig Zag Rd
- 11056 S Lake Run Rd
- 4492 W Enid Dr
- 4352 Degray Dr
- 4338 W Degray Dr
- 10643 S Granby Way
- 10643 Granby Way
- 10647 Granby Way
- 10647 S Granby Way
- 10639 S Granby Way
- 10639 Granby Way
- 10649 Granby Way
- 10649 S Granby Way
- 11257 S Holly Springs Dr
- 11138 S Willow Walk Dr
- 6309 W South Jordan Pkwy
- 10651 Granby Way
- 10651 S Granby Way
- 10657 Granby Way
- 10657 S Granby Way
- 10633 S Granby Way
- 4471 Mille Lacs Dr
- 10633 S Granby Way
- 4469 Mille Lacs Dr
- 4467 Mille Lacs Dr