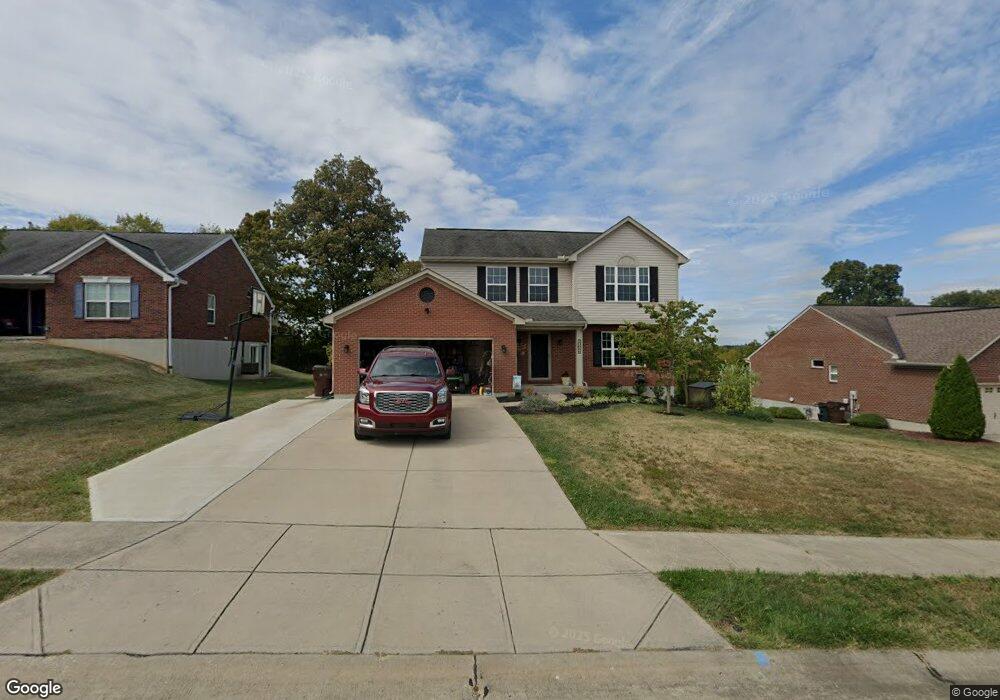
10644 Pepperwood Dr Unit 136WW Independence, KY 41051
Estimated Value: $356,000 - $404,000
4
Beds
3
Baths
1,829
Sq Ft
$209/Sq Ft
Est. Value
About This Home
This home is located at 10644 Pepperwood Dr Unit 136WW, Independence, KY 41051 and is currently estimated at $382,311, approximately $209 per square foot. 10644 Pepperwood Dr Unit 136WW is a home located in Kenton County with nearby schools including Kenton Elementary School, Twenhofel Middle School, and Simon Kenton High School.
Ownership History
Date
Name
Owned For
Owner Type
Purchase Details
Closed on
May 7, 2012
Sold by
Lewallen Patricia A and Ragle Patricia A
Bought by
Younger James A and Younger Mary A
Current Estimated Value
Home Financials for this Owner
Home Financials are based on the most recent Mortgage that was taken out on this home.
Original Mortgage
$175,437
Outstanding Balance
$122,177
Interest Rate
4.01%
Mortgage Type
FHA
Estimated Equity
$260,134
Purchase Details
Closed on
Oct 14, 2010
Sold by
Ragle James A
Bought by
Lewallen Patricia A and Ragle Patricia A
Purchase Details
Closed on
Feb 13, 2009
Sold by
Arlinghaus Builders Llc
Bought by
Ragle James A and Ragle Patricia A
Home Financials for this Owner
Home Financials are based on the most recent Mortgage that was taken out on this home.
Original Mortgage
$149,900
Interest Rate
5.03%
Mortgage Type
Seller Take Back
Purchase Details
Closed on
Apr 27, 2006
Sold by
Arlinghaus I Llc
Bought by
Arlinghaus Builders Llc
Create a Home Valuation Report for This Property
The Home Valuation Report is an in-depth analysis detailing your home's value as well as a comparison with similar homes in the area
Home Values in the Area
Average Home Value in this Area
Purchase History
| Date | Buyer | Sale Price | Title Company |
|---|---|---|---|
| Younger James A | $180,000 | Lawyers Title Cincinnati Inc | |
| Lewallen Patricia A | -- | None Available | |
| Ragle James A | $219,900 | None Available | |
| Arlinghaus Builders Llc | -- | None Available |
Source: Public Records
Mortgage History
| Date | Status | Borrower | Loan Amount |
|---|---|---|---|
| Open | Younger James A | $175,437 | |
| Previous Owner | Ragle James A | $149,900 |
Source: Public Records
Tax History Compared to Growth
Tax History
| Year | Tax Paid | Tax Assessment Tax Assessment Total Assessment is a certain percentage of the fair market value that is determined by local assessors to be the total taxable value of land and additions on the property. | Land | Improvement |
|---|---|---|---|---|
| 2024 | $2,591 | $211,500 | $40,000 | $171,500 |
| 2023 | $2,669 | $211,500 | $40,000 | $171,500 |
| 2022 | $2,728 | $211,500 | $40,000 | $171,500 |
| 2021 | $2,769 | $211,500 | $40,000 | $171,500 |
| 2020 | $2,417 | $180,000 | $40,000 | $140,000 |
| 2019 | $2,423 | $180,000 | $40,000 | $140,000 |
| 2018 | $2,436 | $180,000 | $40,000 | $140,000 |
| 2017 | $2,370 | $180,000 | $40,000 | $140,000 |
| 2015 | $2,302 | $180,000 | $30,900 | $149,100 |
| 2014 | $2,269 | $180,000 | $30,900 | $149,100 |
Source: Public Records
Map
Nearby Homes
- 1095 Audas Ct
- The Lancaster Plan at Williams Woods
- The Courtney Plan at Williams Woods
- The Ella Marie Plan at Williams Woods
- The Marietta Plan at Williams Woods
- The Verona Plan at Williams Woods
- The Avalon Plan at Williams Woods
- The Camden Plan at Williams Woods
- The Mariemont Plan at Williams Woods
- The Livingston Plan at Williams Woods
- The Westchester Plan at Williams Woods
- The Kendall Plan at Williams Woods
- The Waterson Plan at Williams Woods
- The Lincoln Plan at Williams Woods
- The Austin Plan at Williams Woods
- The Leighann Plan at Williams Woods
- The Jefferson Plan at Williams Woods
- The Madison Plan at Williams Woods
- The Morgan Plan at Williams Woods
- The Rosewood Plan at Williams Woods
- 10644 Pepperwood Dr
- 10640 Pepperwood Dr
- 10648 Pepperwood Dr
- 10636 Pepperwood Dr
- 10636 Pepperwood Dr Unit 138WW
- 1130 Laurelwood Ln Unit 134WW
- 1130 Laurelwood Ln
- 10643 Pepperwood Dr
- 10632 Pepperwood Dr
- 10632 Pepperwood Dr Unit 139WW
- 10639 Pepperwood Dr
- 10639 Pepperwood Dr Unit 142WW
- 1119 Laurelwood Ln
- 1123 Laurelwood Ln
- 1123 Laurelwood Ln Unit 128WW
- 1134 Laurelwood Ln
- 1127 Laurelwood Ln
- 1127 Laurelwood Ln Unit 127WW
- 10628 Pepperwood Dr
- 10628 Pepperwood Dr Unit 140WW