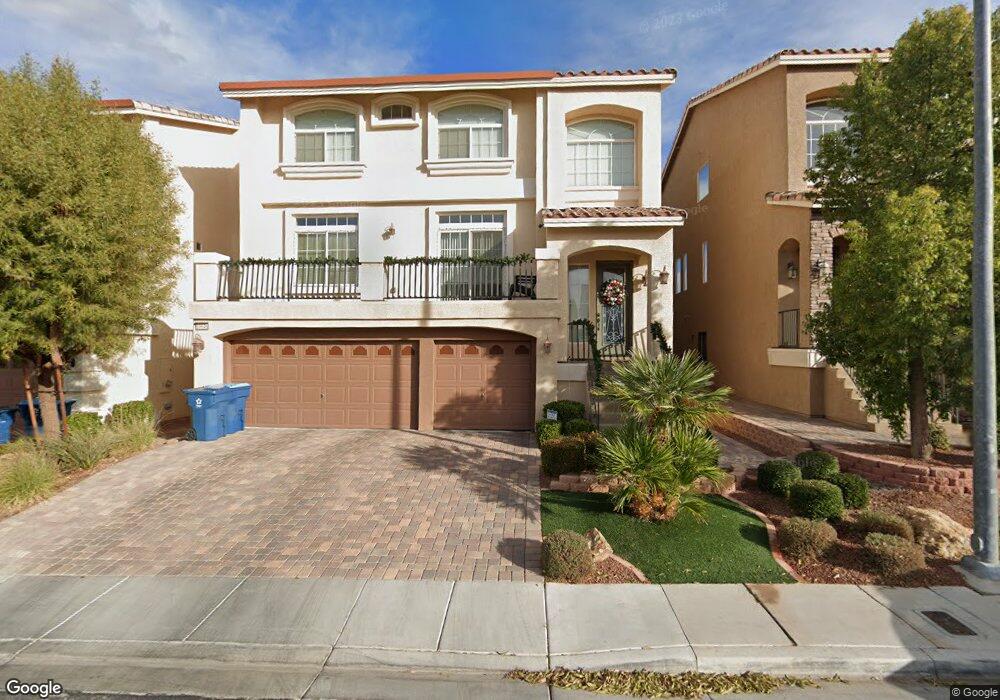
10646 Salmon Leap St Las Vegas, NV 89183
Silverado Ranch NeighborhoodEstimated Value: $687,000 - $772,000
5
Beds
4
Baths
3,987
Sq Ft
$187/Sq Ft
Est. Value
About This Home
This home is located at 10646 Salmon Leap St, Las Vegas, NV 89183 and is currently estimated at $746,877, approximately $187 per square foot. 10646 Salmon Leap St is a home with nearby schools including John C. Bass Elementary School, Charles Silvestri Junior High School, and Liberty High School.
Ownership History
Date
Name
Owned For
Owner Type
Purchase Details
Closed on
Apr 13, 2021
Sold by
Garrett Joseph and Garrett Lissette
Bought by
Garrett Joseph William and Garrett Lissette Herrera
Current Estimated Value
Purchase Details
Closed on
Sep 14, 2012
Sold by
Silverado Summit Llc
Bought by
Garrett Joseph and Garrett Lissette
Home Financials for this Owner
Home Financials are based on the most recent Mortgage that was taken out on this home.
Original Mortgage
$338,715
Outstanding Balance
$232,155
Interest Rate
3.37%
Mortgage Type
FHA
Estimated Equity
$514,722
Purchase Details
Closed on
Mar 30, 2012
Sold by
Silverado Springs 3 Llc
Bought by
Silverado Summit Llc
Purchase Details
Closed on
Nov 9, 2007
Sold by
Silverado Court 1 Inc
Bought by
Silverado Springs 1 Inc
Create a Home Valuation Report for This Property
The Home Valuation Report is an in-depth analysis detailing your home's value as well as a comparison with similar homes in the area
Home Values in the Area
Average Home Value in this Area
Purchase History
| Date | Buyer | Sale Price | Title Company |
|---|---|---|---|
| Garrett Joseph William | -- | None Available | |
| Garrett Joseph | $344,965 | First American Title Centra | |
| Silverado Summit Llc | -- | Accommodation | |
| Silverado Springs 1 Inc | -- | First American Title Co Of N |
Source: Public Records
Mortgage History
| Date | Status | Borrower | Loan Amount |
|---|---|---|---|
| Open | Garrett Joseph | $338,715 |
Source: Public Records
Tax History Compared to Growth
Tax History
| Year | Tax Paid | Tax Assessment Tax Assessment Total Assessment is a certain percentage of the fair market value that is determined by local assessors to be the total taxable value of land and additions on the property. | Land | Improvement |
|---|---|---|---|---|
| 2025 | $4,348 | $246,015 | $49,000 | $197,015 |
| 2024 | $4,222 | $246,015 | $49,000 | $197,015 |
| 2023 | $4,222 | $226,447 | $41,650 | $184,797 |
| 2022 | $4,099 | $205,450 | $37,450 | $168,000 |
| 2021 | $3,980 | $191,320 | $32,550 | $158,770 |
| 2020 | $3,861 | $181,658 | $32,550 | $149,108 |
| 2019 | $3,749 | $163,451 | $29,400 | $134,051 |
| 2018 | $3,639 | $162,317 | $22,750 | $139,567 |
| 2017 | $4,508 | $153,693 | $21,350 | $132,343 |
| 2016 | $3,363 | $125,758 | $15,750 | $110,008 |
| 2015 | $2,865 | $116,456 | $18,900 | $97,556 |
| 2014 | $2,781 | $92,007 | $10,500 | $81,507 |
Source: Public Records
Map
Nearby Homes
- 10656 Timber Stand St
- 10590 Medicine Bow St
- 967 Coronado Peak Ave
- 10568 Salmon Leap St
- 855 Beartooth Falls Ct
- 895 Beartooth Falls Ct
- 1041 Grand Cerritos Ave
- 1043 Monte de Oro Ave
- 1069 Coronado Peak Ave
- 10585 Pueblo Springs St
- 854 Sheerwater Ave
- 681 Stone Hammer Ave
- 10925 Sadlers Wells St
- 1050 E Cactus Ave Unit 2017
- 1050 E Cactus Ave Unit 1024
- 1050 E Cactus Ave Unit 2073
- 1050 E Cactus Ave Unit 1080
- 1050 E Cactus Ave Unit 2075
- 577 Leap Frog Ave
- 908 Shining Rose Place
- 10652 Salmon Leap St
- 10642 Salmon Leap St
- 10634 Salmon Leap St
- 10628 Salmon Leap St
- 10664 Salmon Leap St
- 10647 Salmon Leap St
- 10653 Salmon Leap St
- 10641 Salmon Leap St
- 10659 Salmon Leap St
- 10643 Alondra Peak St
- 10622 Salmon Leap St
- 10670 Salmon Leap St
- 10661 Alondra Peak St
- 10661 Alondra Peak St
- 10637 Alondra Peak St
- 10665 Salmon Leap St
- 10625 Salmon Leap St
- 10667 Alondra Peak St
- 10619 Alondra Peak St Unit 2
- 10649 Alondra Peak St