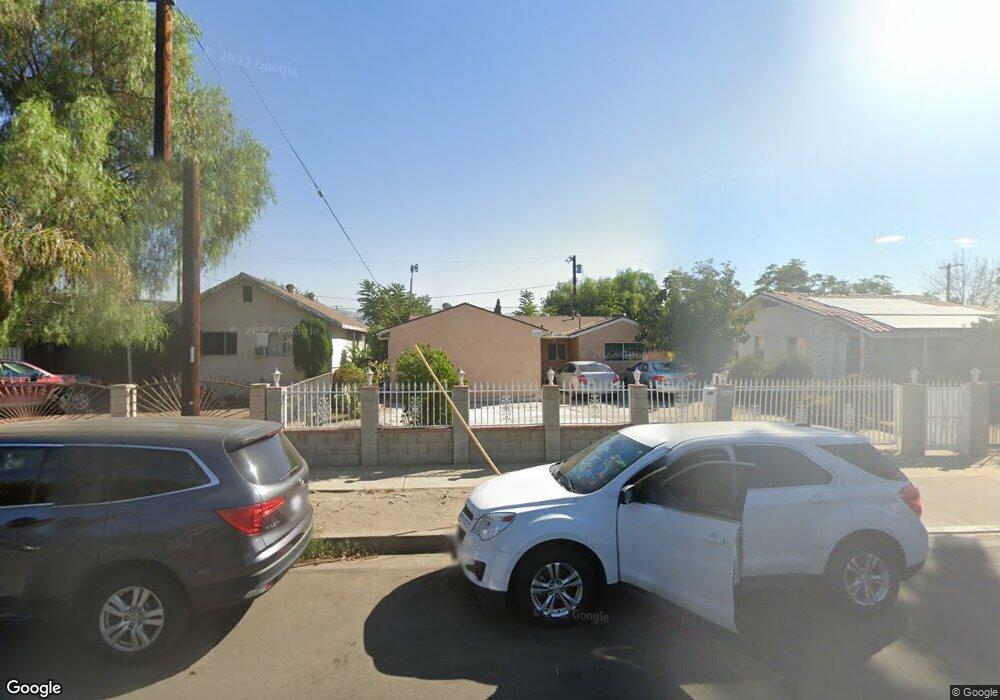
10646 Tamarack Ave Pacoima, CA 91331
Estimated Value: $746,000 - $859,660
4
Beds
3
Baths
1,949
Sq Ft
$410/Sq Ft
Est. Value
About This Home
This home is located at 10646 Tamarack Ave, Pacoima, CA 91331 and is currently estimated at $799,915, approximately $410 per square foot. 10646 Tamarack Ave is a home located in Los Angeles County with nearby schools including Haddon Avenue Elementary School, Pacoima Middle School, and San Fernando Senior High School.
Ownership History
Date
Name
Owned For
Owner Type
Purchase Details
Closed on
Dec 19, 2016
Sold by
Vargas Patricia Ibeth
Bought by
Vargas Carlos Alberto and Vargas Ana
Current Estimated Value
Purchase Details
Closed on
Jun 28, 2012
Sold by
Vargas Carlos Alberto and Vargas Patricia Ibeth
Bought by
Vargas Patricia Ibeth
Purchase Details
Closed on
Aug 11, 2011
Sold by
Vargas Carlos A and Vargas Ana Daisy
Bought by
Vargas Carlos Alberto and Vargas Patricia Ibeth
Purchase Details
Closed on
Sep 26, 1995
Sold by
Vargas Carlos A
Bought by
Vargas Carlos A
Purchase Details
Closed on
Aug 18, 1993
Sold by
Vargas Carlos A and Vargas Luis A
Bought by
Vargas Carlos A
Home Financials for this Owner
Home Financials are based on the most recent Mortgage that was taken out on this home.
Original Mortgage
$90,000
Interest Rate
7.28%
Create a Home Valuation Report for This Property
The Home Valuation Report is an in-depth analysis detailing your home's value as well as a comparison with similar homes in the area
Home Values in the Area
Average Home Value in this Area
Purchase History
| Date | Buyer | Sale Price | Title Company |
|---|---|---|---|
| Vargas Carlos Alberto | -- | None Available | |
| Vargas Patricia Ibeth | -- | None Available | |
| Vargas Carlos Alberto | -- | Stewart Title | |
| Vargas Carlos Alberto | -- | Stewart Title | |
| Vargas Carlos A | -- | -- | |
| Vargas Carlos A | -- | Benefit Land Title Company | |
| Vargas Carlos A | -- | Benefit Land Title Company |
Source: Public Records
Mortgage History
| Date | Status | Borrower | Loan Amount |
|---|---|---|---|
| Previous Owner | Vargas Carlos A | $90,000 |
Source: Public Records
Tax History Compared to Growth
Tax History
| Year | Tax Paid | Tax Assessment Tax Assessment Total Assessment is a certain percentage of the fair market value that is determined by local assessors to be the total taxable value of land and additions on the property. | Land | Improvement |
|---|---|---|---|---|
| 2025 | $3,790 | $300,596 | $155,404 | $145,192 |
| 2024 | $3,790 | $294,703 | $152,357 | $142,346 |
| 2023 | $3,720 | $288,925 | $149,370 | $139,555 |
| 2022 | $3,552 | $283,261 | $146,442 | $136,819 |
| 2021 | $3,499 | $277,708 | $143,571 | $134,137 |
| 2019 | $3,396 | $269,472 | $139,313 | $130,159 |
| 2018 | $5,576 | $455,940 | $319,158 | $136,782 |
| 2016 | $3,116 | $253,931 | $131,279 | $122,652 |
| 2015 | $3,071 | $250,118 | $129,308 | $120,810 |
| 2014 | $3,088 | $245,220 | $126,776 | $118,444 |
Source: Public Records
Map
Nearby Homes
- 13426 Mercer St
- 10853 Ilex Ave
- 13541 Pinney St
- 10615 San Fernando Rd
- 13059 Pierce St
- 13250 Mercer St
- 13700 Filmore St
- 13125 Pinney St
- 13641 Weidner St
- 13258 Filmore St
- 13745 Louvre St
- 13737 Mercer St
- 13762 Judd St
- 10226 Amboy Ave
- 13053 Pinney St
- 10626 Amboy Ave
- 9076 9078 Lev Ave
- 10397 San Fernando
- 11108 Norris Ave
- 10200 Rincon Ave
- 10640 Tamarack Ave
- 10650 Tamarack Ave
- 10656 Tamarack Ave
- 10636 Tamarack Ave
- 10677 El Dorado Ave
- 10630 Tamarack Ave
- 10671 El Dorado Ave
- 10681 El Dorado Ave
- 10667 El Dorado Ave
- 10687 El Dorado Ave
- 10626 Tamarack Ave
- 13368 Van Nuys Blvd
- 10661 El Dorado Ave
- 10647 Tamarack Ave
- 10651 Tamarack Ave
- 10643 Tamarack Ave
- 10693 El Dorado Ave
- 10657 Tamarack Ave
- 10637 Tamarack Ave
- 10657 El Dorado Ave