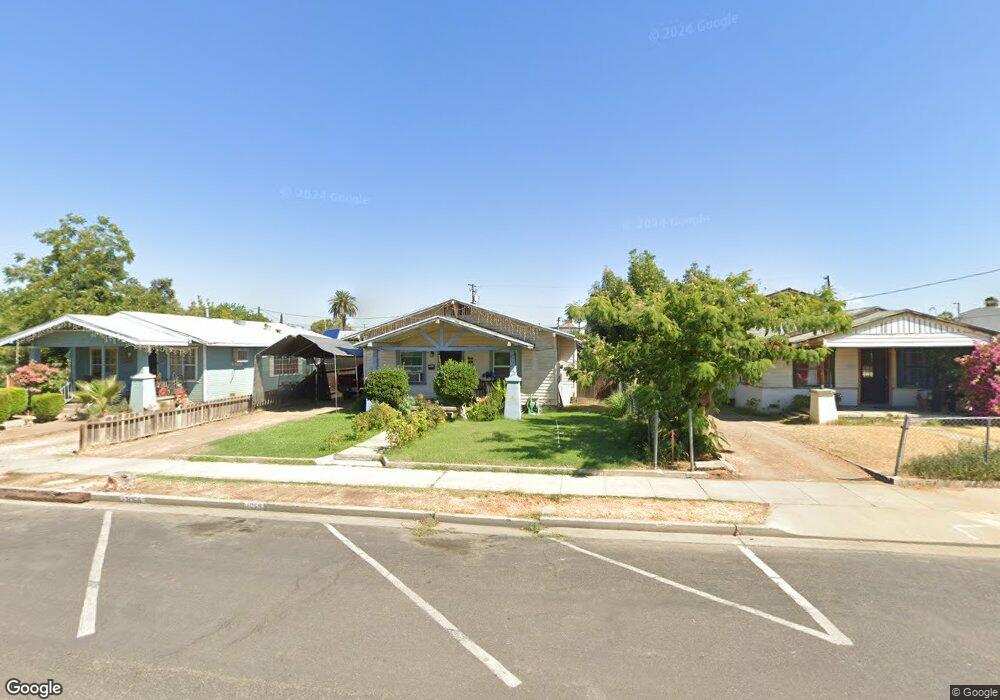
1065 E Elizabeth Way Dinuba, CA 93618
Estimated Value: $167,000 - $280,000
2
Beds
1
Bath
1,059
Sq Ft
$224/Sq Ft
Est. Value
About This Home
This home is located at 1065 E Elizabeth Way, Dinuba, CA 93618 and is currently estimated at $237,511, approximately $224 per square foot. 1065 E Elizabeth Way is a home located in Tulare County with nearby schools including Kennedy Elementary School, Washington Intermediate School, and Dinuba High School.
Ownership History
Date
Name
Owned For
Owner Type
Purchase Details
Closed on
Jun 12, 2014
Sold by
Parker Lynn Canaris
Bought by
Parker Lynn Canaris and Parker Living Trust
Current Estimated Value
Purchase Details
Closed on
Apr 14, 2006
Sold by
Torres Marco A Garcia
Bought by
Torres Marco A Garcia
Purchase Details
Closed on
Nov 27, 2001
Sold by
Perez Richard V
Bought by
Torres Marco A Garcia and Lizaola Julian
Home Financials for this Owner
Home Financials are based on the most recent Mortgage that was taken out on this home.
Original Mortgage
$61,902
Interest Rate
6.8%
Mortgage Type
FHA
Purchase Details
Closed on
Nov 1, 1999
Sold by
Harland Robert J
Bought by
Perez Richard and Perez Esther
Home Financials for this Owner
Home Financials are based on the most recent Mortgage that was taken out on this home.
Original Mortgage
$57,000
Interest Rate
7.68%
Mortgage Type
Seller Take Back
Purchase Details
Closed on
Dec 3, 1998
Sold by
Harland Robert J
Bought by
Harland Robert J and Harland Claudene
Create a Home Valuation Report for This Property
The Home Valuation Report is an in-depth analysis detailing your home's value as well as a comparison with similar homes in the area
Home Values in the Area
Average Home Value in this Area
Purchase History
| Date | Buyer | Sale Price | Title Company |
|---|---|---|---|
| Parker Lynn Canaris | -- | None Available | |
| Torres Marco A Garcia | -- | None Available | |
| Torres Marco A Garcia | $80,500 | Chicago Title Co | |
| Perez Richard | $64,000 | Chicago Title Co | |
| Harland Robert J | -- | -- |
Source: Public Records
Mortgage History
| Date | Status | Borrower | Loan Amount |
|---|---|---|---|
| Previous Owner | Torres Marco A Garcia | $61,902 | |
| Previous Owner | Perez Richard | $57,000 | |
| Closed | Torres Marco A Garcia | $20,000 |
Source: Public Records
Tax History
| Year | Tax Paid | Tax Assessment Tax Assessment Total Assessment is a certain percentage of the fair market value that is determined by local assessors to be the total taxable value of land and additions on the property. | Land | Improvement |
|---|---|---|---|---|
| 2025 | $1,776 | $161,881 | $62,602 | $99,279 |
| 2024 | $1,776 | $158,708 | $61,375 | $97,333 |
| 2023 | $1,760 | $155,597 | $60,172 | $95,425 |
| 2022 | $1,675 | $152,547 | $58,993 | $93,554 |
| 2021 | $1,637 | $149,556 | $57,836 | $91,720 |
| 2020 | $1,446 | $129,000 | $32,000 | $97,000 |
| 2019 | $1,320 | $113,000 | $28,000 | $85,000 |
| 2018 | $1,326 | $116,000 | $29,000 | $87,000 |
| 2017 | $954 | $81,000 | $20,000 | $61,000 |
| 2016 | $812 | $72,000 | $18,000 | $54,000 |
| 2015 | $612 | $84,000 | $21,000 | $63,000 |
| 2014 | $612 | $55,000 | $14,000 | $41,000 |
Source: Public Records
Map
Nearby Homes
- 1166 E Park Way
- 65745 Big Meadows Rd
- 277 N H St
- 1702 Bolinger Way
- 201 Bryan Ave
- 1708 Bolinger Way
- 581 N Crawford Ave Unit 41
- 581 N Crawford Ave Unit 94
- 581 N Crawford Ave Unit 112
- 581 N 581 N Crawford Ave Unit 2
- 0 N Hayes Ave
- 223 Bryan Ave
- 224 Bryan Ave
- 245 Bryan Ave
- 340 N K St
- 1847 E Lauren Ave
- 333 N L St
- 2072 E Olive Way
- 225 W Tulare St
- 200 N Uruapan Way
- 1075 E Elizabeth Way
- 1043 E Elizabeth Way
- 1085 E Elizabeth Way
- 1037 E Elizabeth Way
- 1125 E Elizabeth Way
- 1025 E Elizabeth Way
- 1145 E Elizabeth Way
- 991 E Elizabeth Way
- 1076 E Elizabeth Way
- 1080 E Elizabeth Way
- 1170 E El Monte Way
- 1058 E Elizabeth Way
- 1161 E Elizabeth Way
- 1098 E Elizabeth Way
- 1036 E Elizabeth Way
- 979 E Elizabeth Way
- 1126 E Elizabeth Way
- 1022 E Elizabeth Way
- 1192 E El Monte Way
- 1189 E Elizabeth Way
Your Personal Tour Guide
Ask me questions while you tour the home.