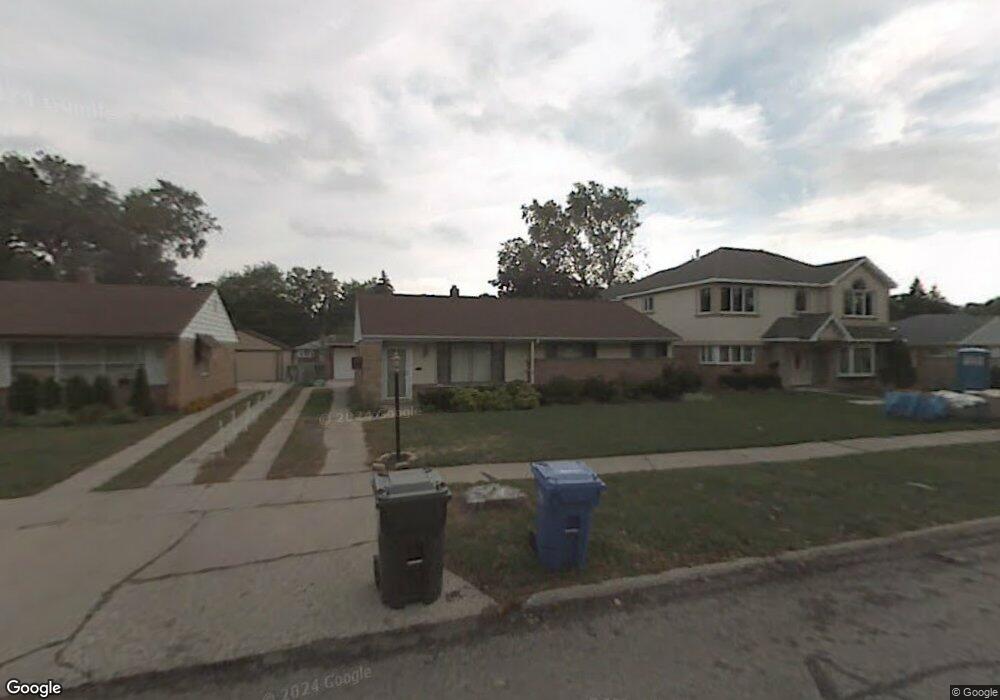
1065 E Grant Dr Des Plaines, IL 60016
Estimated Value: $335,000 - $372,000
3
Beds
2
Baths
1,100
Sq Ft
$323/Sq Ft
Est. Value
About This Home
This home is located at 1065 E Grant Dr, Des Plaines, IL 60016 and is currently estimated at $354,859, approximately $322 per square foot. 1065 E Grant Dr is a home located in Cook County with nearby schools including Forest Elementary School, Algonquin Middle School, and Maine West High School.
Ownership History
Date
Name
Owned For
Owner Type
Purchase Details
Closed on
Nov 17, 2004
Sold by
Adams Christopher R and Adams Gina M
Bought by
Flynn Kimberly
Current Estimated Value
Home Financials for this Owner
Home Financials are based on the most recent Mortgage that was taken out on this home.
Original Mortgage
$225,600
Outstanding Balance
$114,093
Interest Rate
6.3%
Mortgage Type
Unknown
Estimated Equity
$240,766
Purchase Details
Closed on
Aug 10, 2002
Sold by
Witwicki Peter D and Witwicki Peggy K
Bought by
Adams Christopher R and Adams Gina M
Home Financials for this Owner
Home Financials are based on the most recent Mortgage that was taken out on this home.
Original Mortgage
$214,631
Interest Rate
6.29%
Mortgage Type
FHA
Purchase Details
Closed on
Mar 4, 1997
Sold by
Herring Marla Jean
Bought by
Witwicki Peter D and Witwicki Peggy K
Home Financials for this Owner
Home Financials are based on the most recent Mortgage that was taken out on this home.
Original Mortgage
$146,882
Interest Rate
7.73%
Mortgage Type
FHA
Create a Home Valuation Report for This Property
The Home Valuation Report is an in-depth analysis detailing your home's value as well as a comparison with similar homes in the area
Home Values in the Area
Average Home Value in this Area
Purchase History
| Date | Buyer | Sale Price | Title Company |
|---|---|---|---|
| Flynn Kimberly | $282,000 | Bt | |
| Adams Christopher R | $218,000 | -- | |
| Witwicki Peter D | -- | -- |
Source: Public Records
Mortgage History
| Date | Status | Borrower | Loan Amount |
|---|---|---|---|
| Open | Flynn Kimberly | $225,600 | |
| Previous Owner | Adams Christopher R | $214,631 | |
| Previous Owner | Witwicki Peter D | $146,882 | |
| Closed | Flynn Kimberly | $56,400 |
Source: Public Records
Tax History
| Year | Tax Paid | Tax Assessment Tax Assessment Total Assessment is a certain percentage of the fair market value that is determined by local assessors to be the total taxable value of land and additions on the property. | Land | Improvement |
|---|---|---|---|---|
| 2025 | $5,629 | $31,000 | $7,128 | $23,872 |
| 2024 | $5,629 | $24,665 | $5,940 | $18,725 |
| 2023 | $5,810 | $24,665 | $5,940 | $18,725 |
| 2022 | $5,810 | $26,000 | $5,940 | $20,060 |
| 2021 | $4,333 | $17,427 | $4,950 | $12,477 |
| 2020 | $4,329 | $17,427 | $4,950 | $12,477 |
| 2019 | $4,347 | $19,581 | $4,950 | $14,631 |
| 2018 | $5,116 | $20,541 | $4,356 | $16,185 |
| 2017 | $5,043 | $20,541 | $4,356 | $16,185 |
| 2016 | $5,014 | $20,541 | $4,356 | $16,185 |
| 2015 | $4,421 | $17,247 | $3,762 | $13,485 |
| 2014 | $4,344 | $17,247 | $3,762 | $13,485 |
| 2013 | $4,218 | $17,247 | $3,762 | $13,485 |
Source: Public Records
Map
Nearby Homes
- 1162 W Grant Dr
- 980 W Grant Dr
- 674 E Algonquin Rd
- 886 E Thacker St
- 1205 S Wolf Rd
- 1394 Carol Ln
- 1122 Alfini Dr
- 652 E Prairie Ave
- 1107 E Prairie Ave
- 1080 Bogart St
- 584 S 4th Ave
- 799 Graceland Ave Unit 404A
- 1380 Oakwood Ave Unit 306
- 900 Center St Unit 3A
- 787 Graceland Ave Unit 202B
- 1005 Woodlawn Ave
- 505 Forest Ave
- 556 Orchard Ct
- 508 Crestwood Dr
- 815 E Oakton St Unit 311
- 1073 E Grant Dr
- 1055 E Grant Dr
- 1049 E Grant Dr
- 1083 E Grant Dr
- 1076 S 3rd Ave
- 1082 S 3rd Ave
- 1066 S 3rd Ave
- 1086 S 3rd Ave
- 1041 E Grant Dr
- 1059 S 3rd Ave
- 1091 E Grant Dr
- 1058 S 3rd Ave
- 1066 E Grant Dr
- 1096 S 3rd Ave
- 1058 E Grant Dr
- 1074 E Grant Dr
- 1031 E Grant Dr
- 1052 S 3rd Ave
- 1050 E Grant Dr
- 1084 E Grant Dr
Your Personal Tour Guide
Ask me questions while you tour the home.