1065 Lancaster Square Unit 33 Roswell, GA 30076
Estimated Value: $426,000 - $534,000
--
Bed
--
Bath
--
Sq Ft
0.71
Acres
About This Home
This home is located at 1065 Lancaster Square Unit 33, Roswell, GA 30076 and is currently estimated at $480,177. 1065 Lancaster Square Unit 33 is a home located in Fulton County with nearby schools including Vickery Mill Elementary, Elkins Pointe Middle School, and Roswell High School.
Ownership History
Date
Name
Owned For
Owner Type
Purchase Details
Closed on
Aug 19, 2022
Sold by
Cdkg Llc
Bought by
Mack David and Mack Diana
Current Estimated Value
Purchase Details
Closed on
Aug 28, 2020
Sold by
1699 Land Co Llc
Bought by
Cdkg Llc
Purchase Details
Closed on
May 31, 2013
Sold by
Bill Grant Properties Inc
Bought by
1699 Land Co Llc
Home Financials for this Owner
Home Financials are based on the most recent Mortgage that was taken out on this home.
Original Mortgage
$200,000
Interest Rate
3.37%
Mortgage Type
New Conventional
Purchase Details
Closed on
Apr 27, 2010
Sold by
Bill Grant Custom Homes Llc
Bought by
Bill Grant Properties Inc
Purchase Details
Closed on
Oct 3, 2006
Sold by
Adams Donald J Trust 121588
Bought by
Bill Grant Custom Homes Llc
Purchase Details
Closed on
Apr 29, 2005
Sold by
Chatham Park Dev Corp
Bought by
Adams Donald J Trust 121588
Create a Home Valuation Report for This Property
The Home Valuation Report is an in-depth analysis detailing your home's value as well as a comparison with similar homes in the area
Home Values in the Area
Average Home Value in this Area
Purchase History
| Date | Buyer | Sale Price | Title Company |
|---|---|---|---|
| Mack David | $390,000 | -- | |
| Cdkg Llc | -- | -- | |
| 1699 Land Co Llc | $400,000 | -- | |
| Bill Grant Properties Inc | -- | -- | |
| Bill Grant Custom Homes Llc | $630,000 | -- | |
| Adams Donald J Trust 121588 | $291,500 | -- |
Source: Public Records
Mortgage History
| Date | Status | Borrower | Loan Amount |
|---|---|---|---|
| Previous Owner | 1699 Land Co Llc | $200,000 |
Source: Public Records
Tax History Compared to Growth
Tax History
| Year | Tax Paid | Tax Assessment Tax Assessment Total Assessment is a certain percentage of the fair market value that is determined by local assessors to be the total taxable value of land and additions on the property. | Land | Improvement |
|---|---|---|---|---|
| 2025 | $213 | $43,080 | $43,080 | -- |
| 2023 | $213 | $43,080 | $43,080 | $0 |
| 2022 | $4,898 | $173,520 | $173,520 | $0 |
| 2021 | $3,138 | $98,520 | $98,520 | $0 |
| 2020 | $3,188 | $97,360 | $97,360 | $0 |
| 2019 | $474 | $95,640 | $95,640 | $0 |
| 2018 | $2,636 | $93,400 | $93,400 | $0 |
| 2017 | $2,725 | $93,400 | $93,400 | $0 |
| 2016 | $2,814 | $96,440 | $96,440 | $0 |
| 2015 | $3,352 | $96,440 | $96,440 | $0 |
| 2014 | $2,956 | $96,440 | $96,440 | $0 |
Source: Public Records
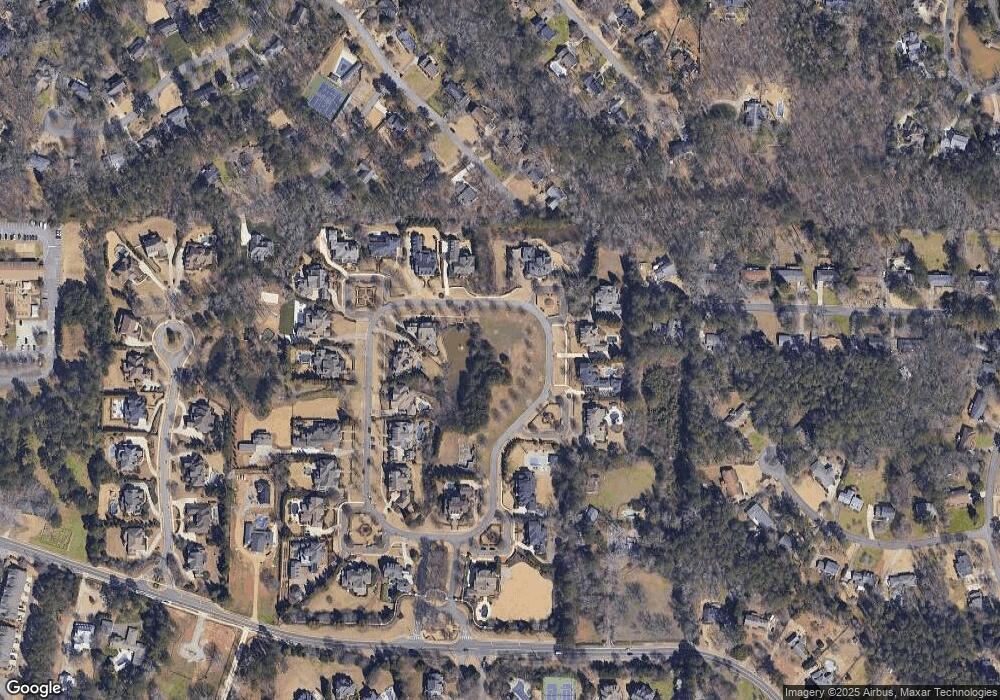
Map
Nearby Homes
- 230 Hollyberry Ct
- 220 Hollyberry Dr
- 11260 Houze Rd
- 3095 Bellingrath Blvd
- 425 Houze Way
- 8730 Parker Place
- 225 Maison Ct
- 200 Bent Grass Dr
- 1055 Wellers Ct
- 110 Great Oaks Ln
- 115 Great Oaks Ln
- 2015 Eagle Ridge
- 5022 Towneship Creek Rd
- 515 Wavetree Dr
- 1020 Olde Roswell Grove
- 1012 Towneship Way
- 1002 Towneship Way
- 178 Victoria Way
- 1065 Lancaster Square
- 1055 Lancaster Square Unit 32
- 1055 Lancaster Square
- 2080 Lancaster Square
- 2070 Lancaster Square
- 1075 Lancaster Square Unit 34
- 2060 Lancaster Square
- 2090 Lancaster Square
- 2040 Lancaster Square
- 1045 Lancaster Square
- 1085 Lancaster Square
- 1085 Lancaster Square Unit 35
- 2030 Lancaster Square
- 1025 Lancaster Square
- 345 Barkshire Ln
- 1035 Lancaster Square
- 3010 Lancaster Square
- 1015 Lancaster Square
- 2020 Lancaster Square
- 0 Lancaster Square Unit 7458209