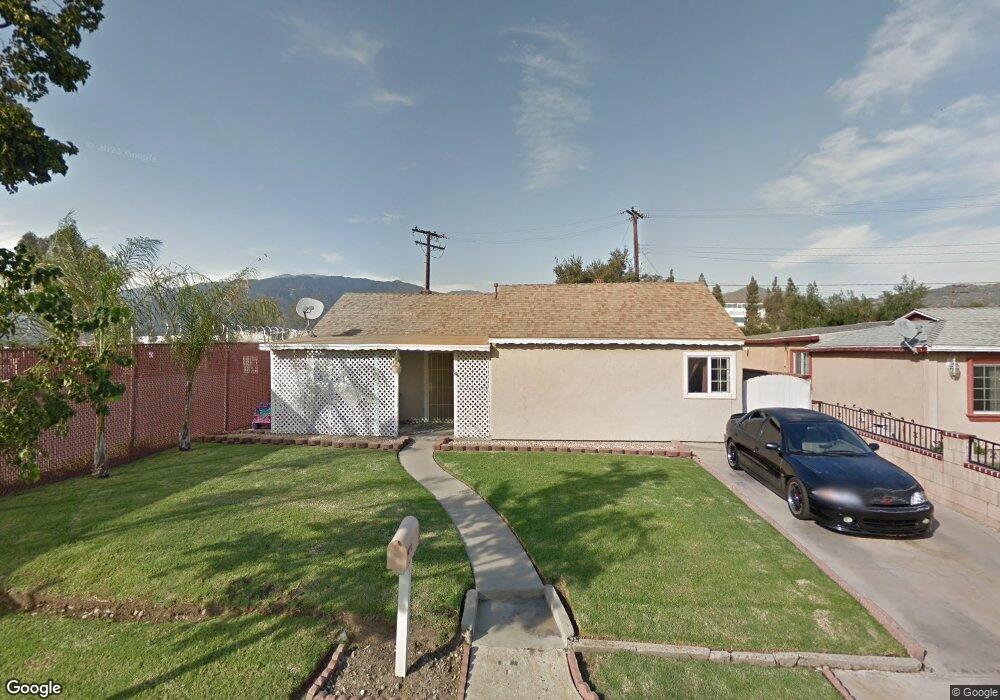
1065 W 4th St Azusa, CA 91702
South Azusa NeighborhoodEstimated Value: $616,518 - $688,000
2
Beds
1
Bath
888
Sq Ft
$720/Sq Ft
Est. Value
About This Home
This home is located at 1065 W 4th St, Azusa, CA 91702 and is currently estimated at $639,130, approximately $719 per square foot. 1065 W 4th St is a home located in Los Angeles County with nearby schools including Gladstone High School, Christbridge Academy, and St. Frances of Rome School.
Ownership History
Date
Name
Owned For
Owner Type
Purchase Details
Closed on
Nov 20, 2020
Sold by
Flynn Patrick Alan
Bought by
Flynn Patrick Alan
Current Estimated Value
Home Financials for this Owner
Home Financials are based on the most recent Mortgage that was taken out on this home.
Original Mortgage
$187,000
Interest Rate
2.8%
Mortgage Type
New Conventional
Purchase Details
Closed on
Nov 23, 2016
Sold by
Flynn Desiree Dawn
Bought by
Flynn Patrick Alan
Home Financials for this Owner
Home Financials are based on the most recent Mortgage that was taken out on this home.
Original Mortgage
$191,000
Interest Rate
4.13%
Mortgage Type
New Conventional
Purchase Details
Closed on
Jan 25, 2006
Sold by
Flynn Patrick Alan and Flynn Patrick
Bought by
Flynn Patrick Alan
Home Financials for this Owner
Home Financials are based on the most recent Mortgage that was taken out on this home.
Original Mortgage
$150,000
Interest Rate
6.21%
Mortgage Type
New Conventional
Create a Home Valuation Report for This Property
The Home Valuation Report is an in-depth analysis detailing your home's value as well as a comparison with similar homes in the area
Home Values in the Area
Average Home Value in this Area
Purchase History
| Date | Buyer | Sale Price | Title Company |
|---|---|---|---|
| Flynn Patrick Alan | -- | Fidelity National Title | |
| Flynn Patrick Alan | -- | Stewart Title Of Ca Inc | |
| Flynn Patrick Alan | -- | Gateway Title Company |
Source: Public Records
Mortgage History
| Date | Status | Borrower | Loan Amount |
|---|---|---|---|
| Closed | Flynn Patrick Alan | $187,000 | |
| Closed | Flynn Patrick Alan | $191,000 | |
| Closed | Flynn Patrick Alan | $150,000 |
Source: Public Records
Tax History Compared to Growth
Tax History
| Year | Tax Paid | Tax Assessment Tax Assessment Total Assessment is a certain percentage of the fair market value that is determined by local assessors to be the total taxable value of land and additions on the property. | Land | Improvement |
|---|---|---|---|---|
| 2025 | $2,597 | $195,426 | $127,459 | $67,967 |
| 2024 | $2,597 | $191,595 | $124,960 | $66,635 |
| 2023 | $2,528 | $187,839 | $122,510 | $65,329 |
| 2022 | $2,493 | $184,157 | $120,108 | $64,049 |
| 2021 | $2,429 | $180,547 | $117,753 | $62,794 |
| 2020 | $2,385 | $178,697 | $116,546 | $62,151 |
| 2019 | $2,349 | $175,194 | $114,261 | $60,933 |
| 2018 | $2,222 | $171,760 | $112,021 | $59,739 |
| 2016 | $2,122 | $165,092 | $107,672 | $57,420 |
| 2015 | $2,087 | $162,613 | $106,055 | $56,558 |
| 2014 | $1,962 | $159,429 | $103,978 | $55,451 |
Source: Public Records
Map
Nearby Homes
- 417 N Vernon Ave
- 532 W 2nd St
- 932 Momax St
- 403 N San Gabriel Ave
- 175 N San Gabriel Ave
- 227 N Azusa Ave
- 936 N Enid Ave
- 900 W Sierra Madre Ave Unit 44
- 890 E Gladstone St
- 11 N San Gabriel Canyon Ave
- 989 W Sierra Madre Ave Unit 4
- 1005 W Sierra Madre Ave Unit 2
- 5527 N Gareloch Ave
- 978 W Calle Del Sol Unit 2
- 1020 W Calle Del Sol Unit 3
- 1190 W Calle Del Sol Unit 4
- 415 S Grandin Ave
- 307 W 11th St
- 207 N Pasadena Ave
- 1172 W Calle de Las Estrellas Unit 3
- 1059 W 4th St
- 1055 W 4th St
- 1060 W 4th St
- 1054 W 4th St
- 1048 W 4th St
- 357 Zachary Padilla Ave
- 353 Zachary Padilla Ave
- 349 Zachary Padilla Ave
- 356 Zachary Padilla Ave
- 1024 W 4th St
- 334 Zachary Padilla Ave
- 1018 W 4th St
- 434 Zachary Padilla Ave
- 1025 W Hollyvale St
- 325 Zachary Padilla Ave
- 1054 W Hollyvale St
- 1048 W Hollyvale St
- 1025 W Bayless St
- 1014 W 4th St
- 1019 W Hollyvale St