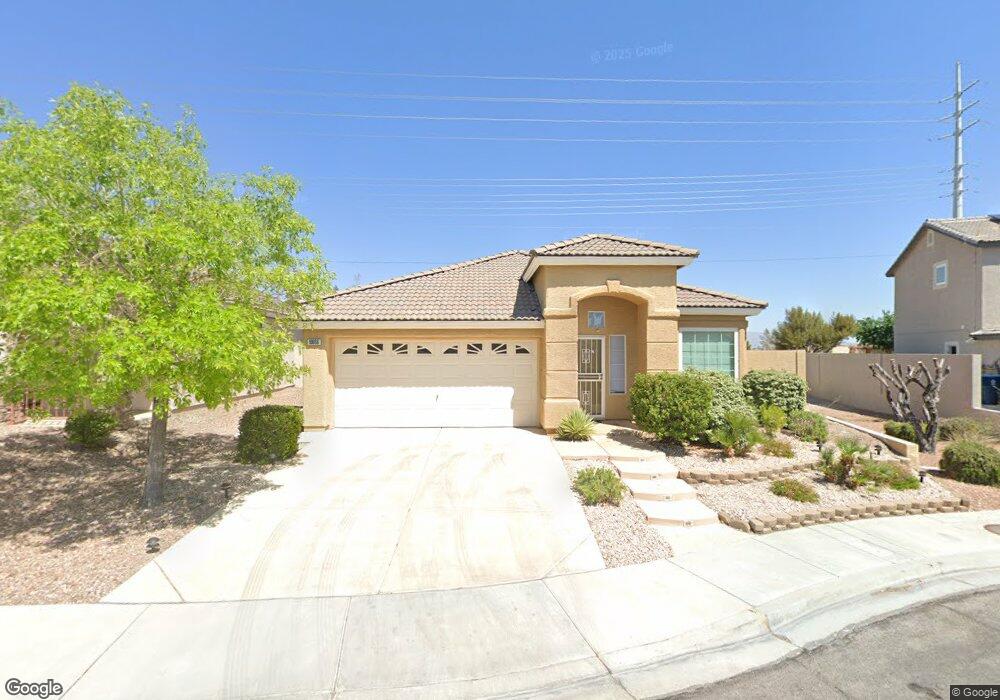
10656 Windrose Point Ave Las Vegas, NV 89144
Summerlin NeighborhoodEstimated Value: $465,000 - $590,000
3
Beds
2
Baths
1,622
Sq Ft
$319/Sq Ft
Est. Value
About This Home
This home is located at 10656 Windrose Point Ave, Las Vegas, NV 89144 and is currently estimated at $517,821, approximately $319 per square foot. 10656 Windrose Point Ave is a home located in Clark County with nearby schools including Ethel W. Staton Elementary School, Sig Rogich Middle School, and Palo Verde High School.
Ownership History
Date
Name
Owned For
Owner Type
Purchase Details
Closed on
Mar 21, 2013
Sold by
Monroy Elsa and Saez Jose Francisco
Bought by
Monroy Elsa
Current Estimated Value
Purchase Details
Closed on
Jun 27, 2006
Sold by
Godoy Elsa and Saez Jose Francisco
Bought by
Monroy Elsa and Saez Jose Francisco
Purchase Details
Closed on
Feb 20, 2004
Sold by
Godoy Elsa
Bought by
Godoy Elsa and Saez Jose Francisco
Purchase Details
Closed on
Jan 27, 2000
Sold by
Godoy Jose Benjamin
Bought by
Godoy Elsa
Home Financials for this Owner
Home Financials are based on the most recent Mortgage that was taken out on this home.
Original Mortgage
$50,000
Interest Rate
7.87%
Purchase Details
Closed on
Jan 13, 2000
Sold by
Coleman Toll Ltd Partnership
Bought by
Godoy Elsa
Home Financials for this Owner
Home Financials are based on the most recent Mortgage that was taken out on this home.
Original Mortgage
$50,000
Interest Rate
7.87%
Create a Home Valuation Report for This Property
The Home Valuation Report is an in-depth analysis detailing your home's value as well as a comparison with similar homes in the area
Home Values in the Area
Average Home Value in this Area
Purchase History
| Date | Buyer | Sale Price | Title Company |
|---|---|---|---|
| Monroy Elsa | -- | None Available | |
| Monroy Elsa | -- | None Available | |
| Monroy Elsa | -- | None Available | |
| Godoy Elsa | -- | -- | |
| Godoy Elsa | -- | United Title | |
| Godoy Elsa | $150,475 | United Title |
Source: Public Records
Mortgage History
| Date | Status | Borrower | Loan Amount |
|---|---|---|---|
| Closed | Godoy Elsa | $50,000 |
Source: Public Records
Tax History Compared to Growth
Tax History
| Year | Tax Paid | Tax Assessment Tax Assessment Total Assessment is a certain percentage of the fair market value that is determined by local assessors to be the total taxable value of land and additions on the property. | Land | Improvement |
|---|---|---|---|---|
| 2025 | $2,193 | $112,850 | $47,950 | $64,900 |
| 2024 | $2,129 | $112,850 | $47,950 | $64,900 |
| 2023 | $2,129 | $95,916 | $34,300 | $61,616 |
| 2022 | $2,067 | $86,028 | $29,750 | $56,278 |
| 2021 | $2,007 | $79,744 | $26,250 | $53,494 |
| 2020 | $1,946 | $78,295 | $25,200 | $53,095 |
| 2019 | $1,889 | $73,631 | $21,350 | $52,281 |
| 2018 | $1,834 | $65,461 | $18,550 | $46,911 |
| 2017 | $2,141 | $65,118 | $17,850 | $47,268 |
| 2016 | $1,737 | $60,784 | $13,300 | $47,484 |
| 2015 | $1,733 | $54,142 | $9,100 | $45,042 |
| 2014 | $1,683 | $53,310 | $7,350 | $45,960 |
Source: Public Records
Map
Nearby Homes
- 10500 Shanna Trellis Ave
- 10525 Mission Lakes Ave
- 10407 Sawmill Ave
- 1617 Stonefield St
- 1812 Monterey Cypress St
- 1900 Bellview St
- 1904 Bellview St
- 1600 Remembrance Hill St
- 10525 Findlay Ave
- 1628 Scenic Peak St
- 2004 Bellview St
- 1709 Pacific Panorama Place
- 10309 Cogswell Ave
- 10528 Cogswell Ave
- 1728 Pacific Castle Place
- 10725 Mission Lakes Ave
- 1716 Pacific Castle Place
- 10260 Copparo Place Unit 4
- 10409 Snyder Ave
- 10616 Englewood Cliffs Ave
- 10660 Windrose Point Ave
- 10652 Windrose Point Ave
- 10664 Windrose Point Ave
- 1840 Stonefield St
- 1840 Stonefield St Unit 999
- 10657 Windrose Point Ave
- 10668 Windrose Point Ave
- 10661 Windrose Point Ave
- 1836 Stonefield St
- 10665 Windrose Point Ave
- 1832 Stonefield St
- 10672 Windrose Point Ave
- 10669 Windrose Point Ave
- 1841 Drifters Peak St
- 1837 Drifters Peak St
- 1833 Drifters Peak St
- 1828 Stonefield St
- 10652 Oak Crest Ave
- 10673 Windrose Point Ave
- 10676 Windrose Point Ave