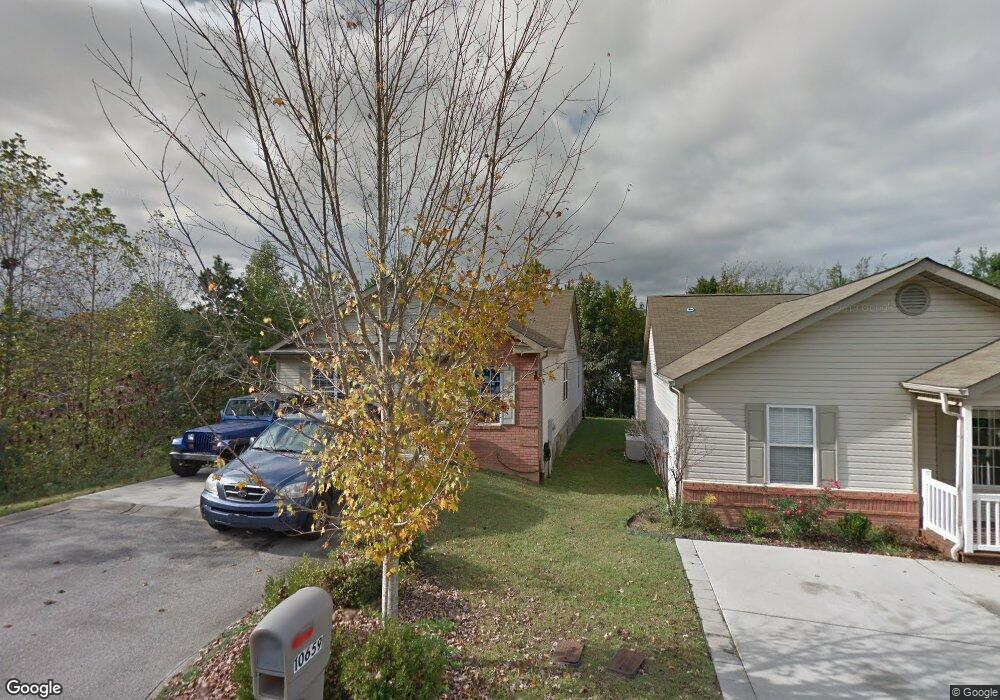
10659 Bitterroot Way Knoxville, TN 37932
West Knoxville NeighborhoodEstimated Value: $308,000 - $362,000
3
Beds
2
Baths
1,320
Sq Ft
$248/Sq Ft
Est. Value
About This Home
This home is located at 10659 Bitterroot Way, Knoxville, TN 37932 and is currently estimated at $327,766, approximately $248 per square foot. 10659 Bitterroot Way is a home located in Knox County with nearby schools including Ball Camp Elementary School, Cedar Bluff Middle School, and Hardin Valley Academy.
Ownership History
Date
Name
Owned For
Owner Type
Purchase Details
Closed on
May 15, 2017
Sold by
Anderson Derek J and Anderson Martha J
Bought by
Wheatley Geoffrey and Wheatley Linda L
Current Estimated Value
Purchase Details
Closed on
Nov 9, 2009
Sold by
Grandy Ralph T and Grandey Ralph T
Bought by
Anderson Derek J and Anderson Martha J
Home Financials for this Owner
Home Financials are based on the most recent Mortgage that was taken out on this home.
Original Mortgage
$123,963
Interest Rate
4.93%
Mortgage Type
FHA
Purchase Details
Closed on
Aug 1, 2003
Sold by
Richardson Carlyn Nadeau and Richardson Les
Bought by
Grandy Ralph T
Purchase Details
Closed on
Mar 29, 2002
Sold by
Carlton Enterprises Inc
Bought by
Nadeau Carlyn C
Home Financials for this Owner
Home Financials are based on the most recent Mortgage that was taken out on this home.
Original Mortgage
$86,803
Interest Rate
6.85%
Mortgage Type
FHA
Create a Home Valuation Report for This Property
The Home Valuation Report is an in-depth analysis detailing your home's value as well as a comparison with similar homes in the area
Home Values in the Area
Average Home Value in this Area
Purchase History
| Date | Buyer | Sale Price | Title Company |
|---|---|---|---|
| Wheatley Geoffrey | $140,000 | Crossland Title | |
| Anderson Derek J | $126,250 | Abstract Title | |
| Grandy Ralph T | $90,100 | -- | |
| Nadeau Carlyn C | $87,500 | Allied Title Company |
Source: Public Records
Mortgage History
| Date | Status | Borrower | Loan Amount |
|---|---|---|---|
| Previous Owner | Anderson Derek J | $123,963 | |
| Previous Owner | Nadeau Carlyn C | $86,803 |
Source: Public Records
Tax History Compared to Growth
Tax History
| Year | Tax Paid | Tax Assessment Tax Assessment Total Assessment is a certain percentage of the fair market value that is determined by local assessors to be the total taxable value of land and additions on the property. | Land | Improvement |
|---|---|---|---|---|
| 2024 | $802 | $51,625 | $0 | $0 |
| 2023 | $802 | $51,625 | $0 | $0 |
| 2022 | $802 | $51,625 | $0 | $0 |
| 2021 | $587 | $27,700 | $0 | $0 |
| 2020 | $587 | $27,700 | $0 | $0 |
| 2019 | $587 | $27,700 | $0 | $0 |
| 2018 | $587 | $27,700 | $0 | $0 |
| 2017 | $587 | $27,700 | $0 | $0 |
| 2016 | $635 | $0 | $0 | $0 |
| 2015 | $635 | $0 | $0 | $0 |
| 2014 | $635 | $0 | $0 | $0 |
Source: Public Records
Map
Nearby Homes
- 10548 Lone Star Way
- 10220 Colt Haven Dr
- 1909 Cedardale Ln
- 1177 Hamilton Farm Ln
- 1714 Yearling Rd
- 10609 Sprawls Point
- 10517 Odin St
- 1844 Pinestraw Ln
- 1809 Plumb Branch Rd Unit I
- 1801 Plumb Branch Rd
- 1145 Hamilton Farm Ln
- 10320 Boston Ln
- 1055 Blinken St
- 1933 Plumb Creek Cir
- 2013 Thompson Rd
- 10604 Alameda Dr
- 10300 Mantooth Ln
- 10732 Yarnell Rd
- 1615 Starboard Way Unit 36
- 10319 Harrison Springs Ln
- 10659 Bitteroot Way
- 10659 Bitteroot Way Unit 3
- 10655 Bitteroot Way
- 10651 Bitteroot Way
- 10651 Bitteroot Way Unit III
- 10647 Bitteroot Way
- 10643 Bitterroot Way
- 10643 Bitteroot Way
- 10656 Bitteroot Way
- 10639 Bitteroot Way
- 10642 Lone Star Way
- 10646 Lone Star Way
- 10638 Lone Star Way
- 10652 Bitteroot Way
- 10648 Bitteroot Way
- 10648 Bitteroot Way Unit 3
- 10634 Lone Star Way
- 10635 Bitteroot Way
- 10635 Bitterroot Way
- 10644 Bitteroot Way