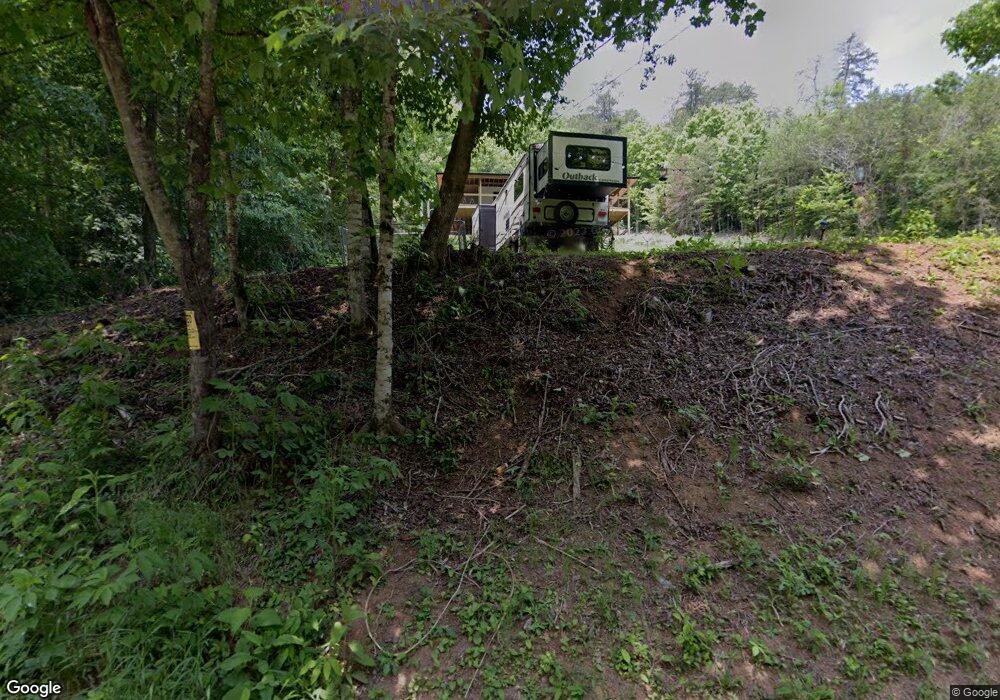
1066 Baysinger Rd Newport, TN 37821
Estimated Value: $155,000 - $319,453
3
Beds
2
Baths
1,568
Sq Ft
$149/Sq Ft
Est. Value
About This Home
This home is located at 1066 Baysinger Rd, Newport, TN 37821 and is currently estimated at $233,113, approximately $148 per square foot. 1066 Baysinger Rd is a home located in Cocke County with nearby schools including Parrottsville Elementary School and Cocke County High School.
Ownership History
Date
Name
Owned For
Owner Type
Purchase Details
Closed on
Sep 10, 2020
Sold by
U S Bank National Association
Bought by
Pate Jack and Pate Linda
Current Estimated Value
Purchase Details
Closed on
Oct 21, 2019
Sold by
Jp Morgan Chase Bank
Bought by
Us Bank National Association and Truman 2016 Sc6 Title Trust
Purchase Details
Closed on
Aug 8, 2019
Sold by
Vandell Mentooth Jr and Mantooth Mary E
Bought by
Jpmorgan Chase Bank National Association
Purchase Details
Closed on
Apr 15, 2004
Sold by
Sutton Mary Ellen
Bought by
Mantooth Vandell
Purchase Details
Closed on
Nov 6, 2003
Sold by
Federal Home Loan Mortgage Corporation
Bought by
Sutton Mary E
Purchase Details
Closed on
Oct 30, 2002
Bought by
Federal Home Loan Mtg Corp % Flagstar Bank
Purchase Details
Closed on
Jul 18, 2001
Sold by
Lanier Audrey Y and Lanier Charles
Bought by
Williams Joseph H
Create a Home Valuation Report for This Property
The Home Valuation Report is an in-depth analysis detailing your home's value as well as a comparison with similar homes in the area
Home Values in the Area
Average Home Value in this Area
Purchase History
| Date | Buyer | Sale Price | Title Company |
|---|---|---|---|
| Pate Jack | $27,500 | None Available | |
| Us Bank National Association | -- | None Available | |
| Jpmorgan Chase Bank National Association | $28,887 | None Available | |
| Mantooth Vandell | $75,000 | -- | |
| Sutton Mary E | $25,000 | -- | |
| Federal Home Loan Mtg Corp % Flagstar Bank | $79,100 | -- | |
| Williams Joseph H | $11,500 | -- |
Source: Public Records
Tax History Compared to Growth
Tax History
| Year | Tax Paid | Tax Assessment Tax Assessment Total Assessment is a certain percentage of the fair market value that is determined by local assessors to be the total taxable value of land and additions on the property. | Land | Improvement |
|---|---|---|---|---|
| 2024 | $1,019 | $39,800 | $6,075 | $33,725 |
| 2023 | $1,019 | $20,600 | $6,075 | $14,525 |
| 2022 | $528 | $20,600 | $6,075 | $14,525 |
| 2021 | $528 | $20,600 | $6,075 | $14,525 |
| 2020 | $495 | $20,600 | $6,075 | $14,525 |
| 2019 | $495 | $17,475 | $5,275 | $12,200 |
| 2018 | $495 | $17,475 | $5,275 | $12,200 |
| 2017 | $507 | $17,475 | $5,275 | $12,200 |
| 2016 | $452 | $17,475 | $5,275 | $12,200 |
| 2015 | $529 | $17,475 | $5,275 | $12,200 |
| 2014 | $529 | $17,475 | $5,275 | $12,200 |
| 2013 | $529 | $22,050 | $7,300 | $14,750 |
Source: Public Records
Map
Nearby Homes
- 952 Stokes Valley Way
- 441 Tennessee 340
- 441 N Highway 340
- 213 N Ridge Dr
- 602 Tennessee 340
- 1830 Old Parrottsville Hwy
- 919 Tennessee 340
- 000 Fowler Grove Rd
- 00 Fowler Grove Rd
- 0 Fowler Grove Rd
- 2405 Bluejay St
- 1488 Grandeur Ave
- 1478 Grandeur Ave
- 4 acres Highway 321
- 00 Bruner Grove Rd
- 0 Clear Creek Rd
- 453 Trentham Hollow Rd
- Lot 7 Lonesome Pine Rd
- LOT 6 Lonesome Pine Rd
- 110 West Dr
- 1066 Baysinger Rd
- 0 Baysinger Rd
- 3 Baysinger Rd
- Lot 3 Baysinger Rd
- Parcel 045.0 Baysinger Rd
- Lot 3 Baysinger Rd
- 1097 Baysinger Rd
- 0 Parcel 045 08 Baysinger Rd Unit 1057938
- 1095 Baysinger Rd
- 000 Baysinger Rd
- 0 Talley Rd Unit 607261
- 0 Talley Rd
- 555 Talley Rd
- 944 Baysinger Rd
- 0 Tbd Talley Rd
- 906 Baysinger Rd
- 1167 Baysinger Rd
- 445 Talley Rd
- - Talley Rd
- 440 Talley Rd