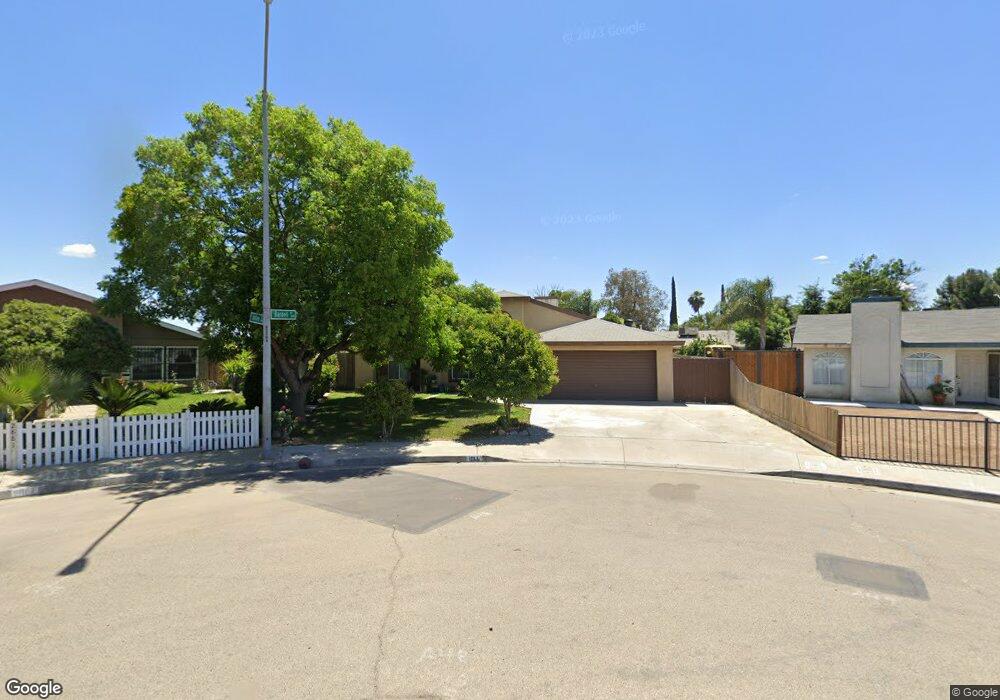
1066 E Jolson Ave Fresno, CA 93706
Edison NeighborhoodEstimated Value: $285,000 - $383,000
3
Beds
2
Baths
1,614
Sq Ft
$209/Sq Ft
Est. Value
About This Home
This home is located at 1066 E Jolson Ave, Fresno, CA 93706 and is currently estimated at $336,532, approximately $208 per square foot. 1066 E Jolson Ave is a home located in Fresno County with nearby schools including West Fresno Middle School, Washington High School, and W.E.B DuBois Academy.
Ownership History
Date
Name
Owned For
Owner Type
Purchase Details
Closed on
Nov 9, 2005
Sold by
Chounlamountry Cjay Thoungsab and Insixiengmay Khamvong
Bought by
Chounlamountry Cjay Thoungsab
Current Estimated Value
Home Financials for this Owner
Home Financials are based on the most recent Mortgage that was taken out on this home.
Original Mortgage
$150,000
Outstanding Balance
$87,855
Interest Rate
7.19%
Mortgage Type
Purchase Money Mortgage
Estimated Equity
$248,677
Purchase Details
Closed on
Jun 12, 2004
Sold by
Insixiengmay Khamvong and Sophouvieng Khankeo
Bought by
Chounlamountry Cjay Thoungsab and Insixiengmay Khamvong
Home Financials for this Owner
Home Financials are based on the most recent Mortgage that was taken out on this home.
Original Mortgage
$108,800
Interest Rate
7.35%
Mortgage Type
New Conventional
Purchase Details
Closed on
Oct 4, 1993
Sold by
Nelson Homes Inc
Bought by
Insixiengmay Khamvong and Sophouvieng Khankeo
Home Financials for this Owner
Home Financials are based on the most recent Mortgage that was taken out on this home.
Original Mortgage
$92,854
Interest Rate
7.21%
Mortgage Type
FHA
Create a Home Valuation Report for This Property
The Home Valuation Report is an in-depth analysis detailing your home's value as well as a comparison with similar homes in the area
Home Values in the Area
Average Home Value in this Area
Purchase History
| Date | Buyer | Sale Price | Title Company |
|---|---|---|---|
| Chounlamountry Cjay Thoungsab | -- | United Independent Title | |
| Chounlamountry Cjay Thoungsab | -- | First American Title Ins Co | |
| Insixiengmay Khamvong | $93,000 | Chicago Title Company |
Source: Public Records
Mortgage History
| Date | Status | Borrower | Loan Amount |
|---|---|---|---|
| Open | Chounlamountry Cjay Thoungsab | $150,000 | |
| Closed | Chounlamountry Cjay Thoungsab | $108,800 | |
| Previous Owner | Insixiengmay Khamvong | $92,854 | |
| Closed | Insixiengmay Khamvong | $3,833 |
Source: Public Records
Tax History
| Year | Tax Paid | Tax Assessment Tax Assessment Total Assessment is a certain percentage of the fair market value that is determined by local assessors to be the total taxable value of land and additions on the property. | Land | Improvement |
|---|---|---|---|---|
| 2025 | $2,544 | $225,364 | $55,345 | $170,019 |
| 2023 | $2,527 | $216,615 | $53,197 | $163,418 |
| 2022 | $2,470 | $212,368 | $52,154 | $160,214 |
| 2021 | $2,276 | $190,000 | $40,000 | $150,000 |
| 2020 | $1,876 | $165,000 | $25,000 | $140,000 |
| 2019 | $1,546 | $134,500 | $33,400 | $101,100 |
| 2018 | $1,510 | $132,000 | $32,800 | $99,200 |
| 2017 | $1,487 | $129,500 | $32,200 | $97,300 |
| 2016 | $1,433 | $123,400 | $30,700 | $92,700 |
| 2015 | $1,292 | $111,300 | $27,700 | $83,600 |
| 2014 | $1,209 | $104,300 | $26,000 | $78,300 |
Source: Public Records
Map
Nearby Homes
- 721 E Annadale Ave
- 2990 S Martin Luther King Junior Blvd
- 385 W Almy Ave
- 1871 E Vine Ave
- 937 E Calwa Ave
- 1150 E Jensen Ave
- 1775 E Vine Ave
- 3232 S Elm Ave
- 506 E Jensen Ave
- 1123 E Garrett Ave
- 1883 E Vine Ave
- 358 E Kaviland Ave
- 0 Apn 328-050-37
- 2555 S Lotus Ave
- 6394 S Cherry Ave
- 0 E Annadale Ave Unit 641839
- 0 E Annadale Ave Unit 641761
- 0 E Annadale Ave Unit 641984
- 2523 S Lily Ave
- 1407 E Church Ave
- 2881 S Bardell Ave
- 1052 E Jolson Ave
- 1073 E Edgar Ave
- 1091 E Edgar Ave
- 1055 E Edgar Ave
- 2877 S Bardell Ave
- 1036 E Jolson Ave
- 1037 E Edgar Ave
- 2873 S Bardell Ave
- 1022 E Jolson Ave
- 1029 E Jolson Ave
- 1019 E Edgar Ave
- 2869 S Bardell Ave
- 1006 E Jolson Ave
- 1013 E Jolson Ave
- 2904 S Bardell Ave
- 2864 S Bardell Ave
- 999 E Edgar Ave
- 2865 S Bardell Ave
- 2905 S Weller Ave
Your Personal Tour Guide
Ask me questions while you tour the home.