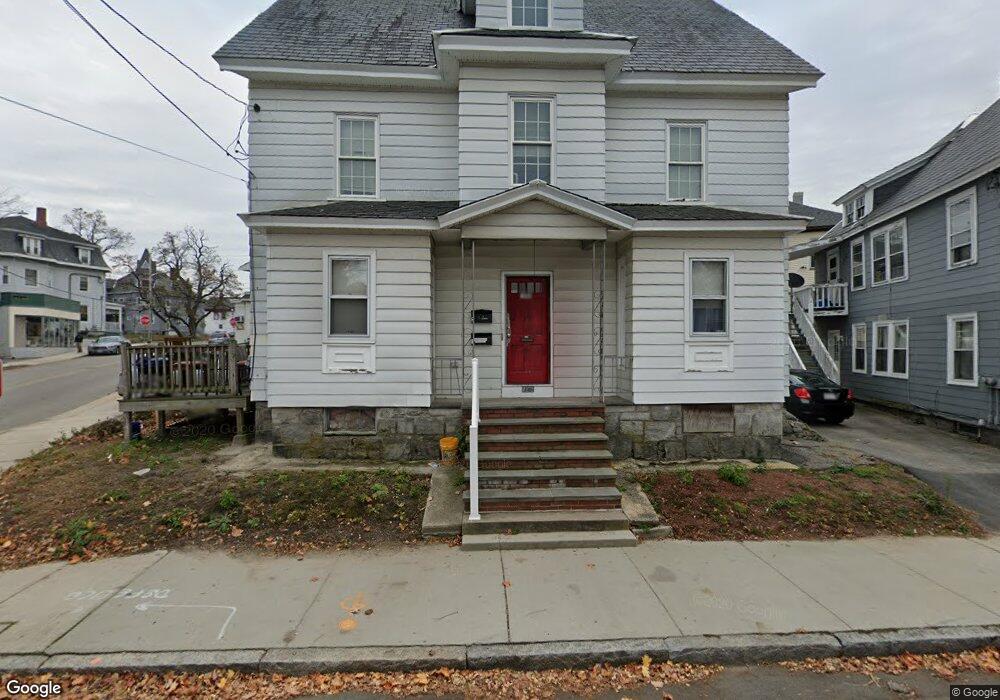
1066 Middlesex St Unit 1 Lowell, MA 01851
Highlands NeighborhoodEstimated Value: $576,487 - $655,000
2
Beds
1
Bath
1,200
Sq Ft
$514/Sq Ft
Est. Value
About This Home
This home is located at 1066 Middlesex St Unit 1, Lowell, MA 01851 and is currently estimated at $617,372, approximately $514 per square foot. 1066 Middlesex St Unit 1 is a home located in Middlesex County with nearby schools including Charles W. Morey Elementary School, Abraham Lincoln Elementary School, and Joseph McAvinnue Elementary School.
Ownership History
Date
Name
Owned For
Owner Type
Purchase Details
Closed on
Jun 2, 2025
Sold by
Singh Inderjeet
Bought by
Singh Inderjeet and Kaur Davinder
Current Estimated Value
Purchase Details
Closed on
Jun 30, 2017
Sold by
Pham Hung Q
Bought by
Singh Inderjeet
Home Financials for this Owner
Home Financials are based on the most recent Mortgage that was taken out on this home.
Original Mortgage
$247,500
Interest Rate
4.02%
Mortgage Type
New Conventional
Purchase Details
Closed on
Jul 24, 2015
Sold by
Rapone Irt and Ducharme
Bought by
Pham Hung Q
Home Financials for this Owner
Home Financials are based on the most recent Mortgage that was taken out on this home.
Original Mortgage
$196,938
Interest Rate
4.01%
Mortgage Type
New Conventional
Purchase Details
Closed on
Nov 17, 2006
Sold by
Rapone Florence E and Rapone Leonard J
Bought by
Rapone Irt and Rapone
Create a Home Valuation Report for This Property
The Home Valuation Report is an in-depth analysis detailing your home's value as well as a comparison with similar homes in the area
Home Values in the Area
Average Home Value in this Area
Purchase History
| Date | Buyer | Sale Price | Title Company |
|---|---|---|---|
| Singh Inderjeet | -- | None Available | |
| Singh Inderjeet | -- | None Available | |
| Singh Inderjeet | $330,000 | -- | |
| Singh Inderjeet | $330,000 | -- | |
| Singh Inderjeet | $330,000 | -- | |
| Pham Hung Q | $263,300 | -- | |
| Pham Hung Q | $263,300 | -- | |
| Pham Hung Q | $263,300 | -- | |
| Rapone Irt | -- | -- | |
| Rapone Irt | -- | -- |
Source: Public Records
Mortgage History
| Date | Status | Borrower | Loan Amount |
|---|---|---|---|
| Previous Owner | Singh Inderjeet | $247,500 | |
| Previous Owner | Pham Hung Q | $196,938 |
Source: Public Records
Tax History
| Year | Tax Paid | Tax Assessment Tax Assessment Total Assessment is a certain percentage of the fair market value that is determined by local assessors to be the total taxable value of land and additions on the property. | Land | Improvement |
|---|---|---|---|---|
| 2025 | $6,069 | $528,700 | $137,000 | $391,700 |
| 2024 | $5,593 | $469,600 | $123,300 | $346,300 |
| 2023 | $5,199 | $418,600 | $107,200 | $311,400 |
| 2022 | $4,811 | $379,100 | $97,500 | $281,600 |
| 2021 | $4,461 | $331,400 | $84,700 | $246,700 |
| 2020 | $4,028 | $301,500 | $74,000 | $227,500 |
| 2019 | $3,782 | $269,400 | $68,600 | $200,800 |
| 2018 | $3,485 | $242,200 | $62,400 | $179,800 |
| 2017 | $3,645 | $244,300 | $56,700 | $187,600 |
| 2016 | $3,584 | $236,400 | $54,000 | $182,400 |
| 2015 | $3,153 | $203,700 | $55,300 | $148,400 |
| 2013 | -- | $206,900 | $66,100 | $140,800 |
Source: Public Records
Map
Nearby Homes
- 19 Lawton St
- 312 Wilder St
- 3 Butman Place
- 490 School St Unit 2
- 49 Marginal St
- 11 Warwick St Unit 3
- 137 Pine St Unit 11
- 17 Edson St
- 42 Branch St
- 45 Harvard St Unit 5 3rd fl
- 68 Smith St
- 206 Cross St
- 1311 Middlesex St
- 18 Burgess St
- 45 Marshall St
- 710 School St
- 15 Barclay St
- 57 Wannalancit St Unit 6
- 57 Wannalancit St Unit 11
- 94 D St
- 1066 Middlesex St
- 249 Branch St
- 237 Branch St
- 1070 Middlesex St
- 255 Branch St
- 298 Walker St
- 302 Walker St
- 259 Branch St
- 1071 Middlesex St
- 281 Walker St
- 1079 Middlesex St
- 282 Walker St
- 263 Branch St
- 225 Branch St
- 1048 Middlesex St
- 1092 Middlesex St
- 265 Branch St
- 246 Branch St
- 242 Branch St
- 242 Branch St Unit A
Your Personal Tour Guide
Ask me questions while you tour the home.