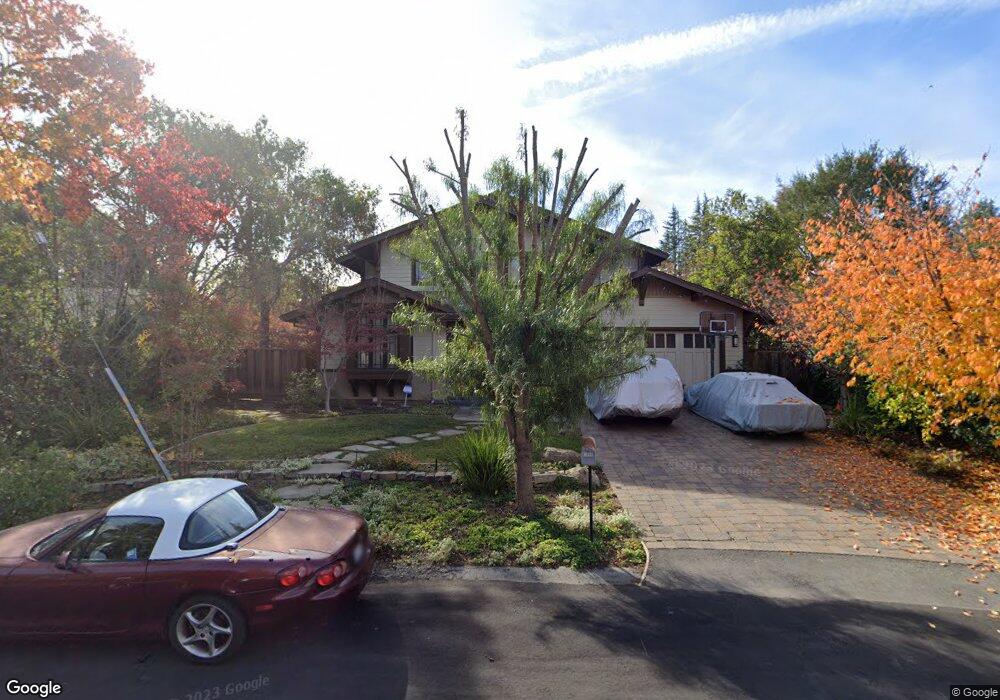
1066 Muir Way Los Altos, CA 94024
Estimated Value: $4,697,000 - $5,447,000
3
Beds
3
Baths
2,600
Sq Ft
$1,925/Sq Ft
Est. Value
About This Home
This home is located at 1066 Muir Way, Los Altos, CA 94024 and is currently estimated at $5,005,951, approximately $1,925 per square foot. 1066 Muir Way is a home located in Santa Clara County with nearby schools including Oak Avenue Elementary School, Georgina P. Blach Junior High School, and Mountain View High School.
Ownership History
Date
Name
Owned For
Owner Type
Purchase Details
Closed on
Aug 16, 2010
Sold by
Oka Keith Y and Oka Karen W
Bought by
Oka Keith Y and Oka Karen W
Current Estimated Value
Home Financials for this Owner
Home Financials are based on the most recent Mortgage that was taken out on this home.
Original Mortgage
$480,000
Outstanding Balance
$317,005
Interest Rate
4.52%
Mortgage Type
New Conventional
Estimated Equity
$4,688,946
Purchase Details
Closed on
Aug 5, 2005
Sold by
Oka Keith Y and Oka Karen W
Bought by
Oka Keith Y and Oka Karen W
Purchase Details
Closed on
Mar 31, 2000
Sold by
Molnia Bruce F and Molnia Mary A
Bought by
Oka Keith Y and Oka Karen W
Home Financials for this Owner
Home Financials are based on the most recent Mortgage that was taken out on this home.
Original Mortgage
$500,000
Interest Rate
7.75%
Create a Home Valuation Report for This Property
The Home Valuation Report is an in-depth analysis detailing your home's value as well as a comparison with similar homes in the area
Home Values in the Area
Average Home Value in this Area
Purchase History
| Date | Buyer | Sale Price | Title Company |
|---|---|---|---|
| Oka Keith Y | -- | Old Republic Title Company | |
| Oka Keith Y | -- | Old Republic Title Company | |
| Oka Keith Y | -- | -- | |
| Oka Keith Y | $1,522,500 | Old Republic Title Company |
Source: Public Records
Mortgage History
| Date | Status | Borrower | Loan Amount |
|---|---|---|---|
| Open | Oka Keith Y | $480,000 | |
| Closed | Oka Keith Y | $500,000 | |
| Closed | Oka Keith Y | $150,000 |
Source: Public Records
Tax History Compared to Growth
Tax History
| Year | Tax Paid | Tax Assessment Tax Assessment Total Assessment is a certain percentage of the fair market value that is determined by local assessors to be the total taxable value of land and additions on the property. | Land | Improvement |
|---|---|---|---|---|
| 2025 | $30,409 | $2,577,300 | $1,690,681 | $886,619 |
| 2024 | $30,409 | $2,526,766 | $1,657,531 | $869,235 |
| 2023 | $29,970 | $2,477,223 | $1,625,031 | $852,192 |
| 2022 | $29,780 | $2,428,651 | $1,593,168 | $835,483 |
| 2021 | $29,822 | $2,381,031 | $1,561,930 | $819,101 |
| 2020 | $29,991 | $2,356,618 | $1,545,915 | $810,703 |
| 2019 | $28,733 | $2,310,410 | $1,515,603 | $794,807 |
| 2018 | $28,197 | $2,265,109 | $1,485,886 | $779,223 |
| 2017 | $27,122 | $2,220,696 | $1,456,751 | $763,945 |
| 2016 | $26,523 | $2,177,154 | $1,428,188 | $748,966 |
| 2015 | $26,205 | $2,144,452 | $1,406,736 | $737,716 |
| 2014 | $25,963 | $2,102,446 | $1,379,180 | $723,266 |
Source: Public Records
Map
Nearby Homes
- 781 Covington Rd
- 1747 Walnut Dr
- 654 Lola Ln
- 2741 Doverton Square
- 1631 Grant Rd
- 1127 Hillslope Place
- 1264 Richardson Ave
- 191 E El Camino Real Unit 138
- 1190 Maria Privada
- 1669 Whitham Ave
- 717 Ehrhorn Ave
- 1125 Plymouth Dr
- 1033 Crestview Dr Unit 207
- 88 Church St
- 11637 Rebecca Ln
- 1881 Alford Ave
- 1341 Belleville Way
- 780 S El Monte Ave
- 920 Oxford Dr
- 1264 Brookings Ln
- 1072 Muir Way
- 1042 Eastwood Dr
- 1077 Eastwood Ct
- 1081 Eastwood Ct
- 1046 Eastwood Dr
- 1000 Eastwood Dr
- 1073 Eastwood Ct
- 1078 Muir Way
- 1085 Eastwood Ct
- 1065 Muir Way
- 1069 Eastwood Ct
- 1077 Muir Way
- 1089 Eastwood Ct
- 1082 Eastwood Ct
- 1078 Eastwood Ct
- 1033 Eastwood Dr
- 1029 Eastwood Dr
- 1043 Eastwood Dr
- 1086 Eastwood Ct
- 1074 Eastwood Ct