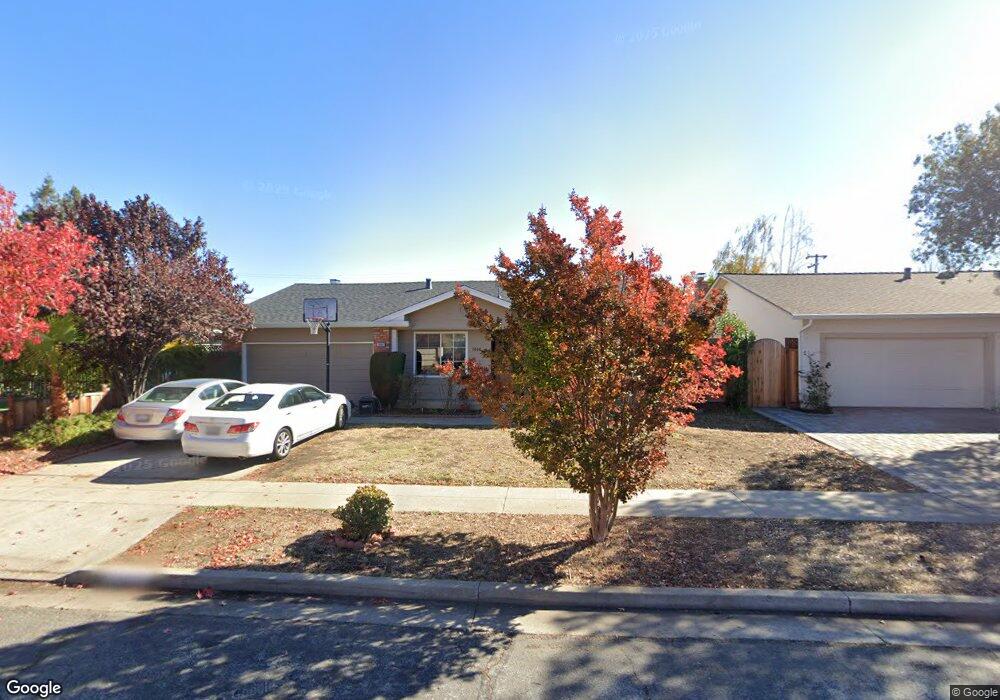
1066 Timbercrest Dr San Jose, CA 95120
Sunrise Almaden NeighborhoodEstimated Value: $1,873,000 - $2,332,635
4
Beds
2
Baths
1,859
Sq Ft
$1,116/Sq Ft
Est. Value
About This Home
This home is located at 1066 Timbercrest Dr, San Jose, CA 95120 and is currently estimated at $2,073,909, approximately $1,115 per square foot. 1066 Timbercrest Dr is a home located in Santa Clara County with nearby schools including Simonds Elementary School, Bret Harte Middle School, and Leland High School.
Ownership History
Date
Name
Owned For
Owner Type
Purchase Details
Closed on
Mar 17, 2016
Sold by
Go Myoung Jun
Bought by
Go Myoung Jun and Son Kwang Hee
Current Estimated Value
Home Financials for this Owner
Home Financials are based on the most recent Mortgage that was taken out on this home.
Original Mortgage
$416,000
Outstanding Balance
$315,194
Interest Rate
2.75%
Mortgage Type
Adjustable Rate Mortgage/ARM
Estimated Equity
$1,758,715
Purchase Details
Closed on
Mar 15, 2016
Sold by
Son Kwang Hee
Bought by
Go Myoung Jun
Home Financials for this Owner
Home Financials are based on the most recent Mortgage that was taken out on this home.
Original Mortgage
$416,000
Outstanding Balance
$315,194
Interest Rate
2.75%
Mortgage Type
Adjustable Rate Mortgage/ARM
Estimated Equity
$1,758,715
Purchase Details
Closed on
Jan 3, 2005
Sold by
Smyth Daniel R
Bought by
Go Myoung Jun and Son Kwang Hee
Home Financials for this Owner
Home Financials are based on the most recent Mortgage that was taken out on this home.
Original Mortgage
$592,000
Interest Rate
4.76%
Mortgage Type
Assumption
Purchase Details
Closed on
Aug 26, 1998
Sold by
Fariborz Azarchehr and Ravani Behnam
Bought by
Smyth Mary Lou
Create a Home Valuation Report for This Property
The Home Valuation Report is an in-depth analysis detailing your home's value as well as a comparison with similar homes in the area
Home Values in the Area
Average Home Value in this Area
Purchase History
| Date | Buyer | Sale Price | Title Company |
|---|---|---|---|
| Go Myoung Jun | -- | Chicago Title Company | |
| Go Myoung Jun | -- | Chicago Title Company | |
| Go Myoung Jun | $740,000 | Old Republic Title Company | |
| Smyth Mary Lou | $417,000 | Old Republic Title Company | |
| Azarchehr Fariborz | -- | Old Republic Title Company |
Source: Public Records
Mortgage History
| Date | Status | Borrower | Loan Amount |
|---|---|---|---|
| Open | Go Myoung Jun | $416,000 | |
| Closed | Go Myoung Jun | $592,000 |
Source: Public Records
Tax History
| Year | Tax Paid | Tax Assessment Tax Assessment Total Assessment is a certain percentage of the fair market value that is determined by local assessors to be the total taxable value of land and additions on the property. | Land | Improvement |
|---|---|---|---|---|
| 2025 | $13,111 | $1,031,479 | $722,041 | $309,438 |
| 2024 | $13,111 | $1,011,255 | $707,884 | $303,371 |
| 2023 | $12,863 | $991,427 | $694,004 | $297,423 |
| 2022 | $12,752 | $971,989 | $680,397 | $291,592 |
| 2021 | $12,493 | $952,931 | $667,056 | $285,875 |
| 2020 | $12,214 | $943,161 | $660,217 | $282,944 |
| 2019 | $11,955 | $924,669 | $647,272 | $277,397 |
| 2018 | $11,837 | $906,539 | $634,581 | $271,958 |
| 2017 | $11,742 | $888,765 | $622,139 | $266,626 |
| 2016 | $11,548 | $871,340 | $609,941 | $261,399 |
| 2015 | $11,473 | $858,253 | $600,780 | $257,473 |
| 2014 | $11,007 | $841,442 | $589,012 | $252,430 |
Source: Public Records
Map
Nearby Homes
- 6563 Camden Ave
- 6414 Hidden Creek Dr
- 6448 Menlo Dr
- 997 Wallace Dr
- 6496 Sproul Ct
- 6644 Mount Hope Dr
- 6433 Bose Ln
- 1155 Parma Dr
- 1031 Mount Darwin Dr
- 6823 Trinidad Dr
- 1113 Silver Oak Ct
- 6404 Camden Ave
- 1108 Holly Oak Cir
- 1141 Holly Oak Cir
- 6805 Almaden Rd
- 1156 Lansdale Ct
- 0 Oak Glen Rd Unit IG25278883
- 1006 Shadow Brook Dr
- 20011 Graystone Ln
- 6332 Mcabee Rd
- 1068 Timbercrest Dr
- 1064 Timbercrest Dr
- 6457 Hidden Creek Ct
- 1062 Timbercrest Dr
- 6459 Hidden Creek Ct
- 1070 Timbercrest Dr
- 6432 Ramblewood Dr
- 6455 Hidden Creek Ct
- 1065 Timbercrest Dr
- 1069 Timbercrest Dr
- 6446 Ramblewood Dr
- 1063 Timbercrest Dr
- 1058 Timbercrest Dr
- 1073 Timbercrest Dr
- 6461 Hidden Creek Ct
- 6458 Ramblewood Dr
- 6453 Hidden Creek Ct
- 1080 Timbercrest Dr
- 6529 Camden Ave
- 1061 Timbercrest Dr
Your Personal Tour Guide
Ask me questions while you tour the home.