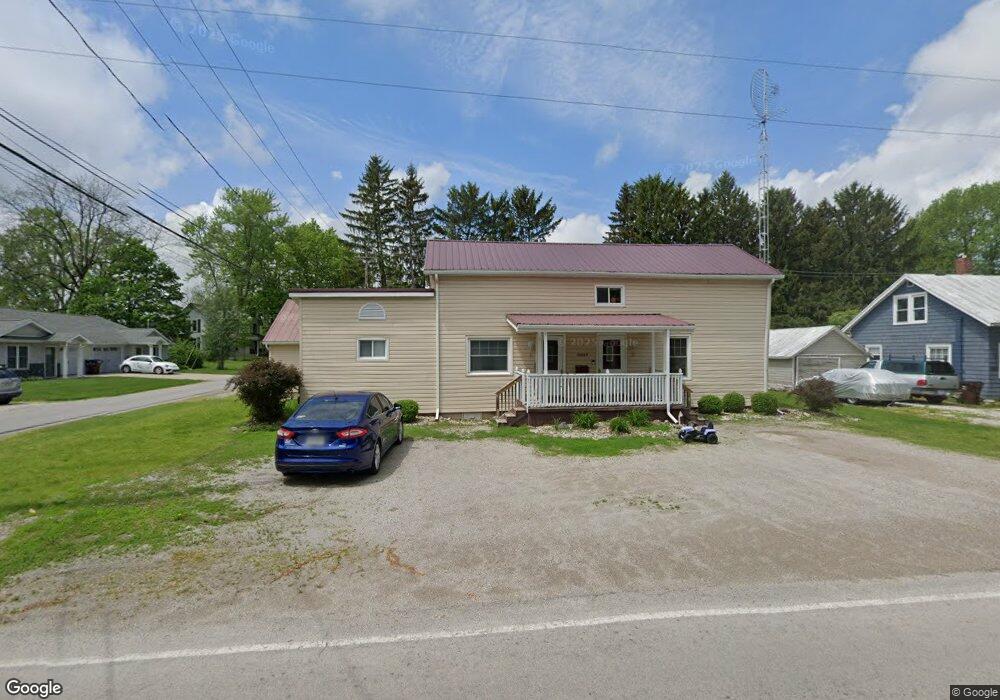
10663 Haller St Defiance, OH 43512
Estimated Value: $122,000 - $184,000
5
Beds
2
Baths
1,998
Sq Ft
$72/Sq Ft
Est. Value
About This Home
This home is located at 10663 Haller St, Defiance, OH 43512 and is currently estimated at $143,879, approximately $72 per square foot. 10663 Haller St is a home located in Defiance County with nearby schools including Noble Elementary School, Tinora Elementary School, and Tinora Middle School.
Ownership History
Date
Name
Owned For
Owner Type
Purchase Details
Closed on
Dec 13, 2019
Sold by
Lockwood Investment Properties Ltd
Bought by
Varner Benjamen P
Current Estimated Value
Purchase Details
Closed on
Jun 26, 2014
Sold by
Varner Benjamin P
Bought by
Lockwood Investments Properties Ltd
Purchase Details
Closed on
Jul 13, 2011
Sold by
Varner Fred N and Varner Barbara R
Bought by
Varner Benjamen P
Purchase Details
Closed on
Jun 5, 2008
Sold by
The Bank Of New York
Bought by
Varner Fred N and Varner Barabara R
Home Financials for this Owner
Home Financials are based on the most recent Mortgage that was taken out on this home.
Original Mortgage
$24,800
Interest Rate
6.04%
Mortgage Type
Commercial
Purchase Details
Closed on
Mar 24, 2008
Sold by
Goins John E and Goins Marlene R
Bought by
Bank Of New York
Purchase Details
Closed on
Apr 14, 2003
Bought by
Lockwood Investment Properties Ltd
Create a Home Valuation Report for This Property
The Home Valuation Report is an in-depth analysis detailing your home's value as well as a comparison with similar homes in the area
Home Values in the Area
Average Home Value in this Area
Purchase History
| Date | Buyer | Sale Price | Title Company |
|---|---|---|---|
| Varner Benjamen P | -- | None Available | |
| Lockwood Investments Properties Ltd | -- | None Available | |
| Varner Benjamen P | $81,000 | -- | |
| Varner Fred N | $31,000 | -- | |
| Bank Of New York | $38,000 | -- | |
| Lockwood Investment Properties Ltd | -- | -- |
Source: Public Records
Mortgage History
| Date | Status | Borrower | Loan Amount |
|---|---|---|---|
| Previous Owner | Varner Fred N | $24,800 |
Source: Public Records
Tax History Compared to Growth
Tax History
| Year | Tax Paid | Tax Assessment Tax Assessment Total Assessment is a certain percentage of the fair market value that is determined by local assessors to be the total taxable value of land and additions on the property. | Land | Improvement |
|---|---|---|---|---|
| 2024 | $1,048 | $29,420 | $1,840 | $27,580 |
| 2023 | $1,048 | $29,420 | $1,840 | $27,580 |
| 2022 | $932 | $22,080 | $1,800 | $20,280 |
| 2021 | $932 | $22,080 | $1,800 | $20,280 |
| 2020 | $929 | $22,080 | $1,800 | $20,280 |
| 2019 | $847 | $20,600 | $1,800 | $18,800 |
| 2018 | $871 | $20,600 | $1,800 | $18,800 |
| 2017 | $762 | $20,601 | $1,802 | $18,799 |
| 2016 | $657 | $17,038 | $1,802 | $15,236 |
| 2015 | -- | $17,059 | $1,802 | $15,257 |
| 2014 | -- | $17,059 | $1,802 | $15,257 |
| 2013 | -- | $17,059 | $1,802 | $15,257 |
| 2012 | -- | $17,060 | $1,803 | $15,257 |
Source: Public Records
Map
Nearby Homes
- 1476 Mustang Dr
- 518 Fugate Dr
- 22140 Switzer Rd
- 321 Harding St
- 383 Maumee River Crossing
- 0 Maumee River Crossing
- 2169 Hawthorne Dr
- 202 Wilson St
- 4120 Misty Shores Rd
- 0 Rose St Unit Lot L 6004739
- 00 Widmer St
- 622 Nicholas St
- 205 Stadium Dr
- 336 Holgate Ave
- 250 Gray St
- 1003 Davidson St
- 724 Thurston St
- 262 Broadway Ave
- 14631 Ohio 15
- 13944 Ohio 15
- 10667 Haller St
- 10627 Haller St
- 10683 Haller St
- 22477 2nd St
- 10705 Haller St
- 22476 2nd St
- 10686 Haller St
- 10702 Market St
- 10626 Haller St
- 22547 2nd St
- 22550 2nd St
- 10725 Haller St
- 10635 Market St
- 0 Market St
- 10724 Market St
- 10745 Haller St
- 10726 Haller St
- 10576 Haller St
- 10695 Market St
- 10687 1st St