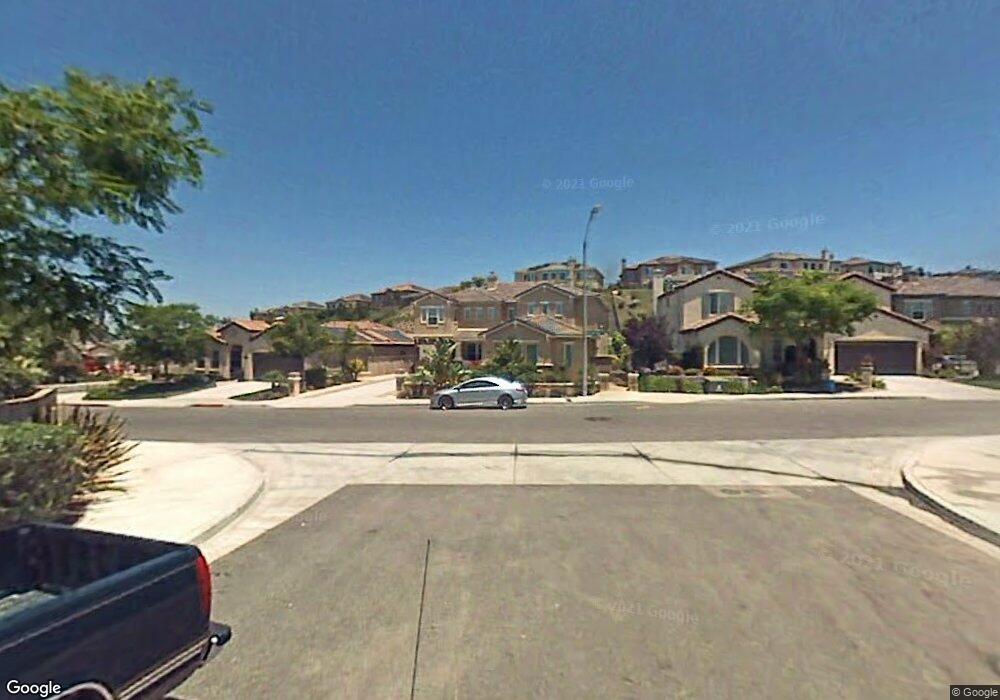
10668 Breckenridge Dr Unit 5 San Diego, CA 92131
Miramar Ranch North NeighborhoodEstimated Value: $2,133,000 - $2,585,000
4
Beds
4
Baths
3,660
Sq Ft
$629/Sq Ft
Est. Value
About This Home
This home is located at 10668 Breckenridge Dr Unit 5, San Diego, CA 92131 and is currently estimated at $2,303,608, approximately $629 per square foot. 10668 Breckenridge Dr Unit 5 is a home located in San Diego County with nearby schools including Miramar Ranch Elementary School, Thurgood Marshall Middle School, and Scripps Ranch High School.
Ownership History
Date
Name
Owned For
Owner Type
Purchase Details
Closed on
Mar 26, 2018
Sold by
Chou James and Chou Annie
Bought by
Coons Clint and Dio 4B Trust
Current Estimated Value
Purchase Details
Closed on
Dec 26, 2017
Sold by
Chou James and Chou Annie
Bought by
Chou James and Chou Annie
Home Financials for this Owner
Home Financials are based on the most recent Mortgage that was taken out on this home.
Original Mortgage
$424,100
Interest Rate
3.92%
Mortgage Type
New Conventional
Purchase Details
Closed on
Sep 8, 2003
Sold by
Chou James Chung Ming and Chou Annie Ching Mei
Bought by
Chou James and Chou Annie
Purchase Details
Closed on
Apr 1, 2002
Sold by
Shea Homes Inc
Bought by
Chou James Chung Ming and Chou Annie Ching Mei
Home Financials for this Owner
Home Financials are based on the most recent Mortgage that was taken out on this home.
Original Mortgage
$300,000
Interest Rate
6.78%
Create a Home Valuation Report for This Property
The Home Valuation Report is an in-depth analysis detailing your home's value as well as a comparison with similar homes in the area
Home Values in the Area
Average Home Value in this Area
Purchase History
| Date | Buyer | Sale Price | Title Company |
|---|---|---|---|
| Coons Clint | -- | None Available | |
| Chou James | -- | None Available | |
| Chou James | -- | -- | |
| Chou James Chung Ming | $627,000 | First American Title |
Source: Public Records
Mortgage History
| Date | Status | Borrower | Loan Amount |
|---|---|---|---|
| Previous Owner | Chou James | $424,100 | |
| Previous Owner | Chou James Chung Ming | $300,000 |
Source: Public Records
Tax History Compared to Growth
Tax History
| Year | Tax Paid | Tax Assessment Tax Assessment Total Assessment is a certain percentage of the fair market value that is determined by local assessors to be the total taxable value of land and additions on the property. | Land | Improvement |
|---|---|---|---|---|
| 2025 | $11,483 | $926,102 | $265,903 | $660,199 |
| 2024 | $11,483 | $907,944 | $260,690 | $647,254 |
| 2023 | $11,218 | $890,142 | $255,579 | $634,563 |
| 2022 | $10,855 | $872,689 | $250,568 | $622,121 |
| 2021 | $10,767 | $855,578 | $245,655 | $609,923 |
| 2020 | $10,639 | $846,806 | $243,137 | $603,669 |
| 2019 | $10,428 | $830,203 | $238,370 | $591,833 |
| 2018 | $9,741 | $813,926 | $233,697 | $580,229 |
| 2017 | $9,513 | $797,967 | $229,115 | $568,852 |
| 2016 | $9,364 | $782,322 | $224,623 | $557,699 |
| 2015 | $9,228 | $770,571 | $221,249 | $549,322 |
| 2014 | $9,085 | $755,478 | $216,916 | $538,562 |
Source: Public Records
Map
Nearby Homes
- 11482 Cortina Place
- 11629 Swan Lake Dr Unit 4
- 11365 Affinity Ct Unit 192
- 9960 Scripps Vista Way Unit 116
- 11215 Affinity Ct Unit 80
- 11265 Affinity Ct Unit 103
- 11325 Affinity Ct Unit 151
- 11235 Affinity Ct Unit 68
- 11175 Affinity Ct Unit 45
- 11115 Affinity Ct Unit 1
- 9909 Scripps Westview Way Unit 212
- 11856 Miro Cir
- 9899 Scripps Westview Way Unit 243
- 9899 Scripps Westview Way Unit 244
- 11825 Miro Cir
- 10818 Caminito Arcada
- 9939 Erma Rd Unit 101
- 9959 Erma Rd Unit 104
- 9929 Erma Rd Unit 102
- 9819 Kika Ct
- 10678 Breckenridge Dr
- 10654 Breckenridge Dr Unit 5
- 10690 Breckenridge Dr
- 11582 Winding Ridge Dr Unit 5
- 11576 Winding Ridge Dr Unit 5
- 11588 Winding Ridge Dr
- 11593 Aspendell Dr
- 10702 Breckenridge Dr
- 10393 Wellsona Ct
- 11572 Winding Ridge Dr Unit 5
- 11604 Aspendell Dr
- 11598 Aspendell Dr Unit 5
- 11594 Winding Ridge Dr
- 10387 Wellsona Ct Unit 5
- 11587 Aspendell Dr Unit 5
- 11610 Aspendell Dr
- 11497 Raedene Way
- 11592 Aspendell Dr Unit 5
- 11491 Raedene Way
- 11568 Winding Ridge Dr