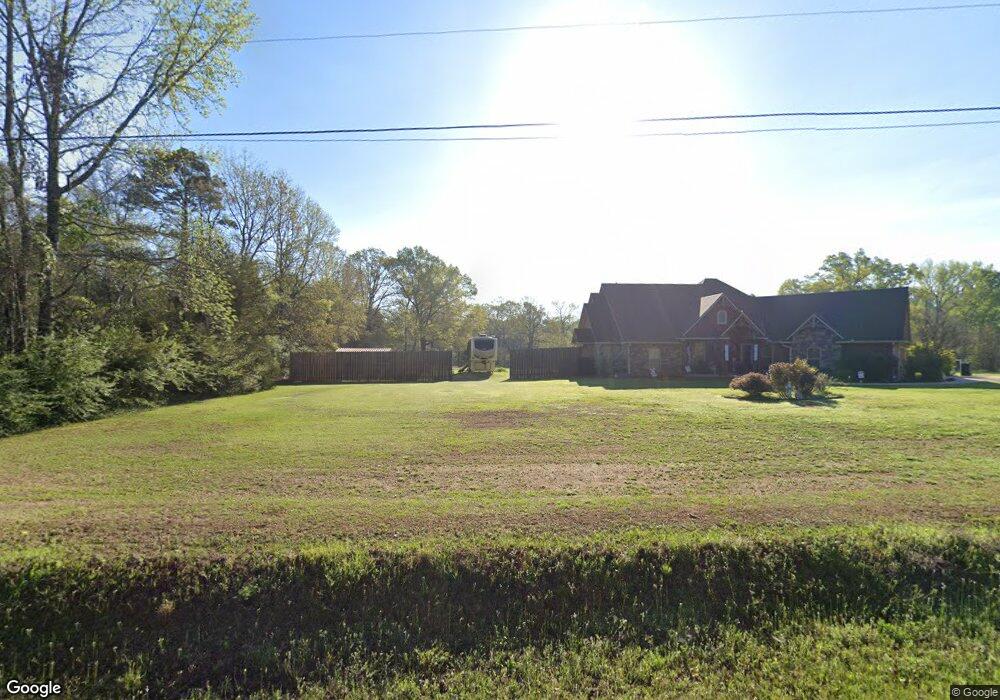
1067 Oliver Rd Haughton, LA 71037
Estimated Value: $284,000 - $425,426
3
Beds
2
Baths
2,229
Sq Ft
$152/Sq Ft
Est. Value
About This Home
This home is located at 1067 Oliver Rd, Haughton, LA 71037 and is currently estimated at $339,857, approximately $152 per square foot. 1067 Oliver Rd is a home with nearby schools including Haughton Elementary School, Haughton Middle School, and Haughton High School.
Ownership History
Date
Name
Owned For
Owner Type
Purchase Details
Closed on
Jan 16, 2019
Sold by
Culpepper Belinda G and Culpepper Betty F
Bought by
Price Belinda G and Price John E
Current Estimated Value
Purchase Details
Closed on
Jun 29, 2015
Sold by
Culpepper Odia Darren and Culpepper Beelinda G
Bought by
Culpepper Belinda G and Culpepper Betty F
Home Financials for this Owner
Home Financials are based on the most recent Mortgage that was taken out on this home.
Original Mortgage
$275,000
Interest Rate
3.9%
Mortgage Type
Future Advance Clause Open End Mortgage
Create a Home Valuation Report for This Property
The Home Valuation Report is an in-depth analysis detailing your home's value as well as a comparison with similar homes in the area
Home Values in the Area
Average Home Value in this Area
Purchase History
| Date | Buyer | Sale Price | Title Company |
|---|---|---|---|
| Price Belinda G | -- | -- | |
| Culpepper Belinda G | -- | None Available |
Source: Public Records
Mortgage History
| Date | Status | Borrower | Loan Amount |
|---|---|---|---|
| Previous Owner | Culpepper Belinda G | $275,000 |
Source: Public Records
Tax History
| Year | Tax Paid | Tax Assessment Tax Assessment Total Assessment is a certain percentage of the fair market value that is determined by local assessors to be the total taxable value of land and additions on the property. | Land | Improvement |
|---|---|---|---|---|
| 2024 | $3,296 | $36,257 | $1,400 | $34,857 |
| 2023 | $2,986 | $31,603 | $1,400 | $30,203 |
| 2022 | $2,970 | $31,603 | $1,400 | $30,203 |
| 2021 | $2,970 | $31,603 | $1,400 | $30,203 |
| 2020 | $2,430 | $27,170 | $1,400 | $25,770 |
| 2019 | $2,460 | $27,170 | $1,400 | $25,770 |
| 2018 | $2,460 | $27,170 | $1,400 | $25,770 |
| 2017 | $2,430 | $27,170 | $1,400 | $25,770 |
| 2016 | $36 | $3,520 | $1,400 | $2,120 |
| 2015 | $36 | $4,070 | $1,400 | $2,670 |
Source: Public Records
Map
Nearby Homes
- 1244 Oliver Road Lot 1
- 0 Oliver Rd
- 177 Sitka Loop
- 127 Sitka Loop
- 133 Sitka Loop
- 125 Sitka Loop
- 7245 Highway 157
- 247 Owl Ln
- 1252 Oliver Rd
- 191 Bent Tree Loop
- 2 Oliver Rd
- 13 Oliver Rd
- 4 Oliver Rd
- 198 Bent Tree Loop
- 411 S Elm St
- 410 Cross Dr
- 13886 Louisiana 157
- 631 Haughton Trace Ct
- 603 Haughton Trace Ct
- 605 Haughton Trace Ct
Your Personal Tour Guide
Ask me questions while you tour the home.